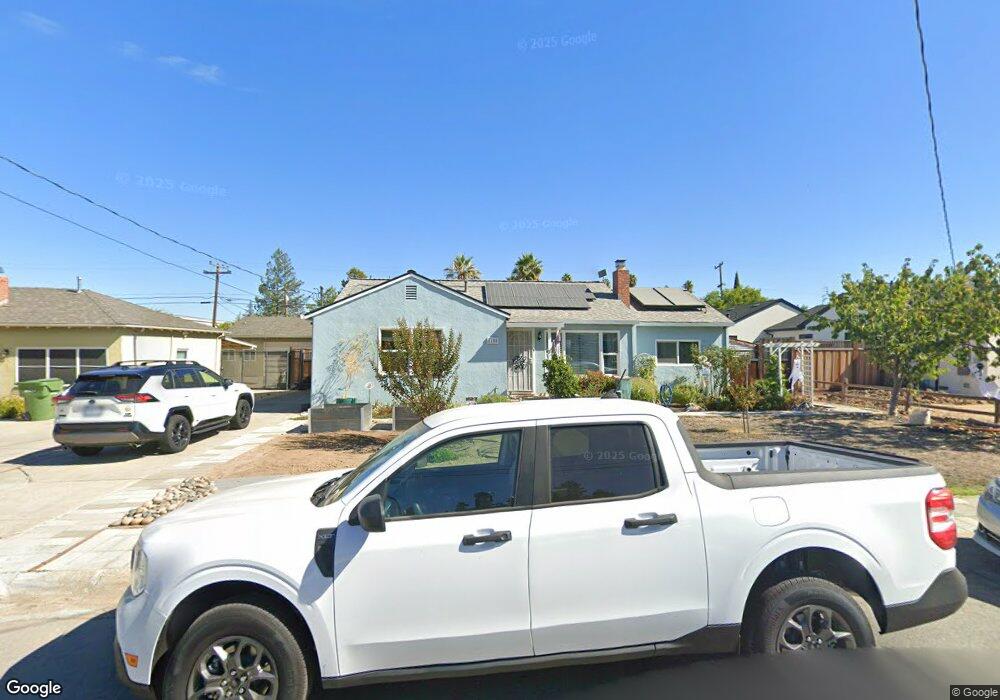
1108 Salerno Dr Campbell, CA 95008
Cambrian NeighborhoodEstimated Value: $1,880,000 - $1,904,429
3
Beds
2
Baths
1,296
Sq Ft
$1,457/Sq Ft
Est. Value
About This Home
This home is located at 1108 Salerno Dr, Campbell, CA 95008 and is currently estimated at $1,887,857, approximately $1,456 per square foot. 1108 Salerno Dr is a home located in Santa Clara County with nearby schools including Branham High School, Farnham Elementary School, and Fammatre Elementary School.
Ownership History
Date
Name
Owned For
Owner Type
Purchase Details
Closed on
Dec 21, 2010
Sold by
Decou Candace
Bought by
Decou Candace
Current Estimated Value
Home Financials for this Owner
Home Financials are based on the most recent Mortgage that was taken out on this home.
Original Mortgage
$150,000
Interest Rate
4.34%
Mortgage Type
Credit Line Revolving
Purchase Details
Closed on
Jun 8, 2006
Sold by
Decou Candace M
Bought by
Decou Candace
Purchase Details
Closed on
May 2, 2006
Sold by
Decou Candace M and Decou Terae
Bought by
Decou Candace M
Purchase Details
Closed on
Oct 24, 2003
Sold by
Decou Candace M
Bought by
Decou Candace M and Decou Terae
Purchase Details
Closed on
Jul 28, 1997
Sold by
Decou Candace M
Bought by
Decou Candace M
Home Financials for this Owner
Home Financials are based on the most recent Mortgage that was taken out on this home.
Original Mortgage
$160,000
Interest Rate
4.95%
Create a Home Valuation Report for This Property
The Home Valuation Report is an in-depth analysis detailing your home's value as well as a comparison with similar homes in the area
Home Values in the Area
Average Home Value in this Area
Purchase History
| Date | Buyer | Sale Price | Title Company |
|---|---|---|---|
| Decou Candace | -- | North American Title Co Inc | |
| Decou Candace | -- | North American Title Co Inc | |
| Decou Candace | -- | None Available | |
| Decou Candace M | -- | None Available | |
| Decou Candace M | $70,000 | Title Company | |
| Decou Candace M | -- | American Title Co |
Source: Public Records
Mortgage History
| Date | Status | Borrower | Loan Amount |
|---|---|---|---|
| Closed | Decou Candace | $150,000 | |
| Closed | Decou Candace M | $160,000 |
Source: Public Records
Tax History
| Year | Tax Paid | Tax Assessment Tax Assessment Total Assessment is a certain percentage of the fair market value that is determined by local assessors to be the total taxable value of land and additions on the property. | Land | Improvement |
|---|---|---|---|---|
| 2025 | $2,853 | $145,798 | $41,785 | $104,013 |
| 2024 | $2,853 | $142,940 | $40,966 | $101,974 |
| 2023 | $2,850 | $140,138 | $40,163 | $99,975 |
| 2022 | $2,834 | $137,391 | $39,376 | $98,015 |
| 2021 | $2,769 | $134,698 | $38,604 | $96,094 |
| 2020 | $2,926 | $133,318 | $38,209 | $95,109 |
| 2019 | $2,956 | $130,705 | $37,460 | $93,245 |
| 2018 | $2,938 | $128,143 | $36,726 | $91,417 |
| 2017 | $2,803 | $125,631 | $36,006 | $89,625 |
| 2016 | $2,668 | $123,168 | $35,300 | $87,868 |
| 2015 | $2,605 | $121,319 | $34,770 | $86,549 |
| 2014 | $2,510 | $118,943 | $34,089 | $84,854 |
Source: Public Records
Map
Nearby Homes
- 404 Shamrock Dr
- 2785 S Bascom Ave Unit 26
- 956 Norin Ct
- 481 Dallas Dr
- 1500 Camden Ave
- 1155 Shamrock Dr
- 1061 Shamrock Dr
- 2265 Sun Glory Ln Unit B
- 341 Dallas Dr
- 2867 Via Carmen
- 2209 Casa Mia Dr
- 2261 Central Park Dr
- 3449 Wine Cask Way
- 1526 Redding Park Ln
- 101 Redding Rd Unit A4
- 192 Shelley Ave
- 3076 Union Ave
- 1980 Foxworthy Ave
- 99 Timber Cove Dr Unit 99
- 870 Camden Ave Unit 96
- 1122 Salerno Dr
- 1092 Salerno Dr
- 1136 Salerno Dr
- 1080 Salerno Dr
- 2250 Tomasina Ct Unit 3
- 2250 Tomasina Ct Unit 1
- 2250 Tomasina Ct
- 2243 Tomasina Ct
- 1115 Salerno Dr
- 1131 Salerno Dr
- 1101 Salerno Dr
- 1150 Salerno Dr
- 1066 Salerno Dr
- 2237 Tomasina Ct
- 2244 Tomasina Ct
- 1089 Salerno Dr Unit 2
- 1089 Salerno Dr
- 1145 Salerno Dr
- 2242 Angela Ct
- 1058 Salerno Dr
Your Personal Tour Guide
Ask me questions while you tour the home.