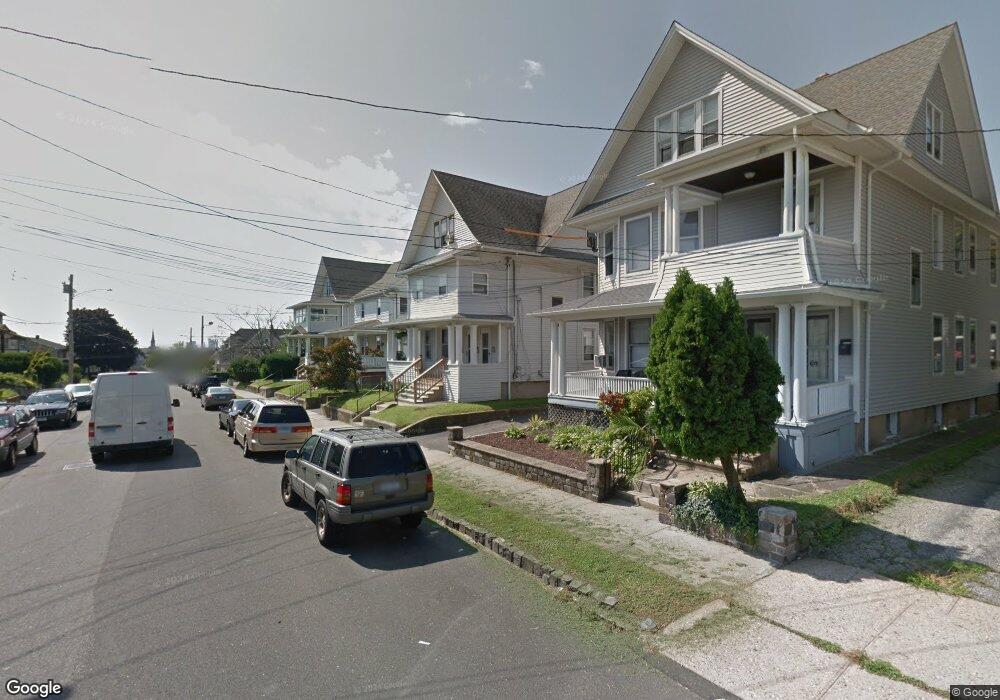
111 Anson St Bridgeport, CT 06606
Brooklawn-Saint Vincent NeighborhoodEstimated Value: $628,000 - $783,000
5
Beds
3
Baths
2,942
Sq Ft
$234/Sq Ft
Est. Value
About This Home
This home is located at 111 Anson St, Bridgeport, CT 06606 and is currently estimated at $688,988, approximately $234 per square foot. 111 Anson St is a home located in Fairfield County with nearby schools including Read School, Central High School, and Catholic Academy of Bridgeport-St. Raphael Academy.
Ownership History
Date
Name
Owned For
Owner Type
Purchase Details
Closed on
Jun 21, 2012
Sold by
Saint Vincents Dev Inc
Bought by
Hawley Ave Holdings Ll
Current Estimated Value
Purchase Details
Closed on
May 2, 2008
Sold by
Russo Robert D
Bought by
Saint Vincents Dev Inc
Purchase Details
Closed on
Nov 22, 2005
Sold by
Paulo Anibal
Bought by
Russo Robert
Create a Home Valuation Report for This Property
The Home Valuation Report is an in-depth analysis detailing your home's value as well as a comparison with similar homes in the area
Home Values in the Area
Average Home Value in this Area
Purchase History
| Date | Buyer | Sale Price | Title Company |
|---|---|---|---|
| Hawley Ave Holdings Ll | -- | -- | |
| Hawley Ave Holdings Ll | -- | -- | |
| Saint Vincents Dev Inc | $415,000 | -- | |
| Saint Vincents Dev Inc | $415,000 | -- | |
| Russo Robert | $415,000 | -- | |
| Russo Robert | $415,000 | -- |
Source: Public Records
Mortgage History
| Date | Status | Borrower | Loan Amount |
|---|---|---|---|
| Previous Owner | Russo Robert | $30,000 |
Source: Public Records
Tax History Compared to Growth
Tax History
| Year | Tax Paid | Tax Assessment Tax Assessment Total Assessment is a certain percentage of the fair market value that is determined by local assessors to be the total taxable value of land and additions on the property. | Land | Improvement |
|---|---|---|---|---|
| 2025 | $8,527 | $196,240 | $71,740 | $124,500 |
| 2024 | $8,527 | $196,240 | $71,740 | $124,500 |
| 2023 | $8,527 | $196,240 | $71,740 | $124,500 |
| 2022 | $8,527 | $196,240 | $71,740 | $124,500 |
| 2021 | $8,527 | $196,240 | $71,740 | $124,500 |
| 2020 | $8,183 | $151,560 | $48,290 | $103,270 |
| 2019 | $8,183 | $151,560 | $48,290 | $103,270 |
| 2018 | $8,240 | $151,560 | $48,290 | $103,270 |
| 2017 | $8,240 | $151,560 | $48,290 | $103,270 |
| 2016 | $8,240 | $151,560 | $48,290 | $103,270 |
| 2015 | $8,120 | $192,410 | $48,710 | $143,700 |
| 2014 | $8,120 | $192,410 | $48,710 | $143,700 |
Source: Public Records
Map
Nearby Homes
- 330 French St
- 936 Lindley St
- 508 Hawley Ave
- 2395 Main St Unit 2397
- 724 Capitol Ave Unit 726
- 106 Manhattan Ave Unit 108
- 119 Madison Terrace
- 123 Harlem Ave
- 926 Hart St
- 916 Hart St
- 390 Charles St Unit 106
- 203 Wayne St
- 252 Harlem Ave Unit B6
- 252 Harlem Ave Unit B5
- 76 Porter St
- 39 Infield St
- 1265 Lindley St
- 105 Tremont Ave Unit E
- 105 Tremont Ave Unit B
- 631 Fairview Ave