111 N Monroe St Bay City, MI 48708
Estimated Value: $114,000 - $133,983
4
Beds
2
Baths
1,665
Sq Ft
$75/Sq Ft
Est. Value
About This Home
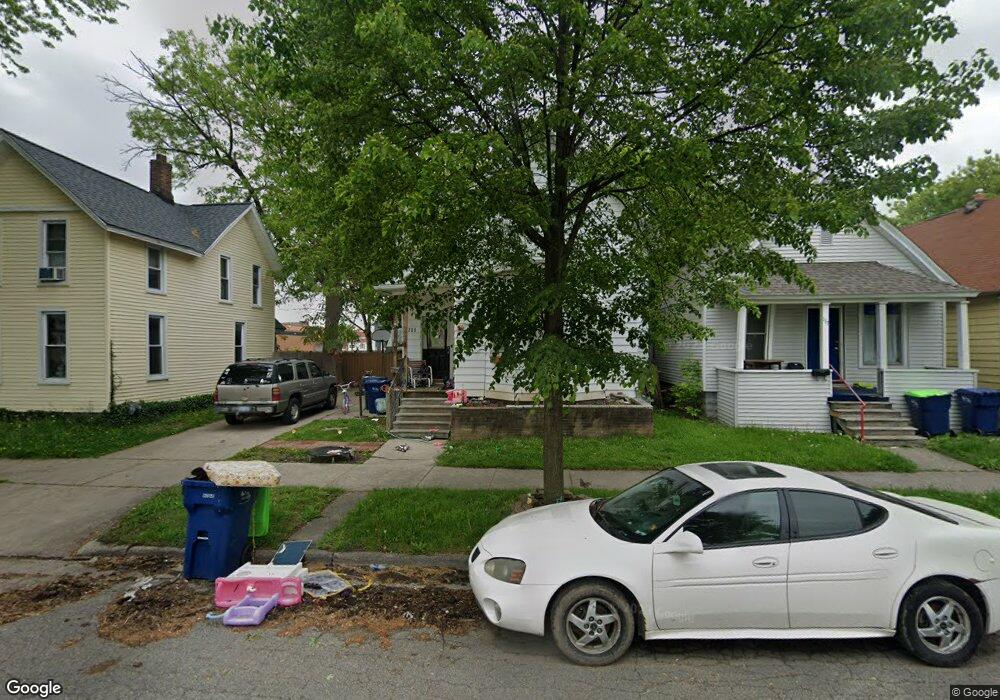
This home is located at 111 N Monroe St, Bay City, MI 48708 and is currently estimated at $124,996, approximately $75 per square foot. 111 N Monroe St is a home located in Bay County with nearby schools including Washington Elementary School, Handy Middle School, and Bay City Central High School.
Ownership History
Date
Name
Owned For
Owner Type
Purchase Details
Closed on
Jun 8, 2016
Sold by
Reinbolt Duke and Walther Kristin Janssen
Bought by
Walther Kristin Janssen
Current Estimated Value
Purchase Details
Closed on
Jan 29, 2016
Sold by
Andrezjewski Kyle
Bought by
Walther Kristin Janssen and Reinbolt Duke
Purchase Details
Closed on
Mar 31, 2015
Sold by
Arts District Llc
Bought by
Andrezjewski Kyle
Purchase Details
Closed on
Mar 26, 2015
Sold by
Arts District Llc
Bought by
Adrezjewski Kyle
Purchase Details
Closed on
May 25, 2011
Sold by
Walverine Bank
Bought by
Ingersoll Steven J
Purchase Details
Closed on
Nov 11, 2010
Sold by
Frank Randall L
Bought by
Wolverine Bank
Purchase Details
Closed on
Nov 8, 2002
Bought by
Mulholland Thomas S
Purchase Details
Closed on
Oct 5, 2001
Sold by
Neveau Mark F
Bought by
Bank One, National Association
Purchase Details
Closed on
Jun 12, 1997
Sold by
Hess Robert and Hess Rebecca A
Bought by
Neveau Mark F
Create a Home Valuation Report for This Property
The Home Valuation Report is an in-depth analysis detailing your home's value as well as a comparison with similar homes in the area
Home Values in the Area
Average Home Value in this Area
Purchase History
| Date | Buyer | Sale Price | Title Company |
|---|---|---|---|
| Walther Kristin Janssen | -- | None Available | |
| Walther Kristin Janssen | -- | Attorney | |
| Andrezjewski Kyle | -- | None Available | |
| Adrezjewski Kyle | -- | None Available | |
| Ingersoll Steven J | $8,000 | Mbt Title Services Llc | |
| Wolverine Bank | -- | None Available | |
| Mulholland Thomas S | $31,000 | -- | |
| Bank One, National Association | $34,000 | -- | |
| Neveau Mark F | $33,000 | -- |
Source: Public Records
Tax History Compared to Growth
Tax History
| Year | Tax Paid | Tax Assessment Tax Assessment Total Assessment is a certain percentage of the fair market value that is determined by local assessors to be the total taxable value of land and additions on the property. | Land | Improvement |
|---|---|---|---|---|
| 2025 | $2,069 | $62,800 | $0 | $0 |
| 2024 | $1,702 | $55,900 | $0 | $0 |
| 2023 | $1,621 | $48,800 | $0 | $0 |
| 2022 | $2,067 | $43,900 | $0 | $0 |
| 2021 | $1,751 | $41,150 | $41,150 | $0 |
| 2020 | $1,862 | $38,500 | $38,500 | $0 |
| 2019 | $1,821 | $37,950 | $0 | $0 |
| 2018 | $1,803 | $36,700 | $0 | $0 |
| 2017 | $2,515 | $37,400 | $0 | $0 |
| 2016 | $3,155 | $35,450 | $0 | $35,450 |
| 2015 | $1,444 | $32,800 | $0 | $32,800 |
| 2014 | $1,444 | $28,150 | $0 | $28,150 |
Source: Public Records
Map
Nearby Homes
- 609 11th St
- 224 N Madison Ave
- 251 N Van Buren St
- 1010 13th St
- 110 Fitzhugh St
- 301 N Van Buren St
- 701 15th St
- 234 N Farragut St
- 302 N Farragut St
- 208 S Sheridan St
- 000 County Road 246 West Ave
- 523 Fraser St
- 510 N Farragut St
- 714 S Madison Ave
- 413 Franklin St
- 709 S Van Buren St
- 904 6th St
- 808 19th St
- 1517 11th St
- 1010 6th Street 6th St
- 113 N Monroe St
- 107 N Monroe St
- 119 N Monroe St
- 607 Columbus Ave
- 112 N Madison Ave
- 110 N Madison Ave
- 116 N Madison Ave
- 610 11th St
- 614 11th St
- 122 N Madison Ave
- 112 N Monroe St
- 108 N Monroe St
- 116 N Monroe St
- 104 N Monroe St
- 701 Columbus Ave
- 120 N Monroe St
- 700 11th St
- 124 N Madison Ave
- 600 Columbus Ave
- 600 Columbus Ave Unit 106 S MONROE ST