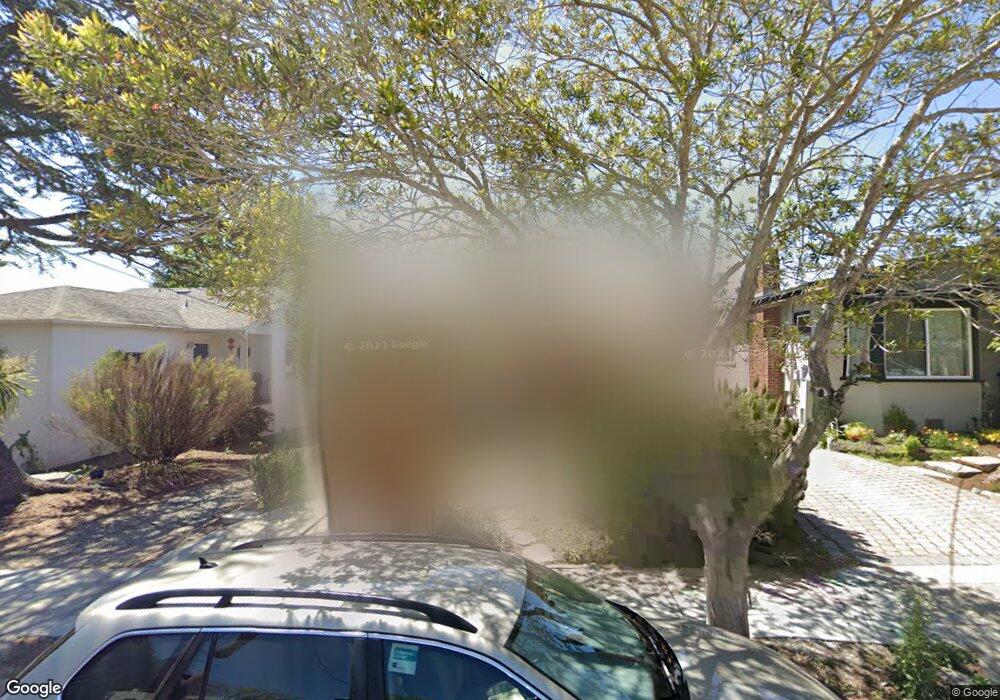
1110 Neilson St Albany, CA 94706
Albany Terrace NeighborhoodEstimated Value: $1,163,000 - $1,422,000
3
Beds
1
Bath
1,126
Sq Ft
$1,125/Sq Ft
Est. Value
About This Home
This home is located at 1110 Neilson St, Albany, CA 94706 and is currently estimated at $1,266,479, approximately $1,124 per square foot. 1110 Neilson St is a home located in Alameda County with nearby schools including Albany Middle School, Albany High School, and The Crowden School.
Ownership History
Date
Name
Owned For
Owner Type
Purchase Details
Closed on
Nov 21, 2018
Sold by
Carrillo Denys
Bought by
Carrillo Denys and Denys Carrillo Living Trust
Current Estimated Value
Purchase Details
Closed on
Jun 28, 2005
Sold by
Finn Joseph Alexander
Bought by
Carrillo Denys
Home Financials for this Owner
Home Financials are based on the most recent Mortgage that was taken out on this home.
Original Mortgage
$150,000
Outstanding Balance
$77,897
Interest Rate
5.58%
Mortgage Type
Fannie Mae Freddie Mac
Estimated Equity
$1,188,582
Purchase Details
Closed on
Jun 27, 2005
Sold by
Tandy Barbara H
Bought by
Carrillo Denys
Home Financials for this Owner
Home Financials are based on the most recent Mortgage that was taken out on this home.
Original Mortgage
$150,000
Outstanding Balance
$77,897
Interest Rate
5.58%
Mortgage Type
Fannie Mae Freddie Mac
Estimated Equity
$1,188,582
Create a Home Valuation Report for This Property
The Home Valuation Report is an in-depth analysis detailing your home's value as well as a comparison with similar homes in the area
Home Values in the Area
Average Home Value in this Area
Purchase History
| Date | Buyer | Sale Price | Title Company |
|---|---|---|---|
| Carrillo Denys | -- | None Available | |
| Carrillo Denys | -- | Old Republic Title Company | |
| Carrillo Denys | $740,000 | Old Republic Title Company |
Source: Public Records
Mortgage History
| Date | Status | Borrower | Loan Amount |
|---|---|---|---|
| Open | Carrillo Denys | $150,000 |
Source: Public Records
Tax History Compared to Growth
Tax History
| Year | Tax Paid | Tax Assessment Tax Assessment Total Assessment is a certain percentage of the fair market value that is determined by local assessors to be the total taxable value of land and additions on the property. | Land | Improvement |
|---|---|---|---|---|
| 2025 | $16,576 | $1,125,880 | $303,354 | $829,526 |
| 2024 | $16,576 | $1,077,855 | $297,406 | $787,449 |
| 2023 | $15,060 | $971,923 | $291,577 | $680,346 |
| 2022 | $14,497 | $945,867 | $285,860 | $667,007 |
| 2021 | $14,316 | $927,190 | $280,257 | $653,933 |
| 2020 | $14,312 | $924,614 | $277,384 | $647,230 |
| 2019 | $13,982 | $906,491 | $271,947 | $634,544 |
| 2018 | $13,571 | $888,724 | $266,617 | $622,107 |
| 2017 | $14,112 | $871,304 | $261,391 | $609,913 |
| 2016 | $13,434 | $854,225 | $256,267 | $597,958 |
| 2015 | $11,984 | $800,000 | $240,000 | $560,000 |
| 2014 | $11,081 | $720,000 | $216,000 | $504,000 |
Source: Public Records
Map
Nearby Homes
- 1108 Neilson St
- 1112 Neilson St
- 1106 Neilson St
- 1116 Neilson St
- 1121 Curtis St
- 1127 Curtis St
- 1117 Curtis St
- 1104 Neilson St
- 1115 Curtis St
- 1129 Curtis St
- 1120 Neilson St
- 1111 Neilson St
- 1117 Neilson St
- 1113 Curtis St
- 1109 Neilson St
- 1102 Neilson St
- 1131 Curtis St
- 1105 Neilson St
- 1123 Neilson St
- 1133 Curtis St