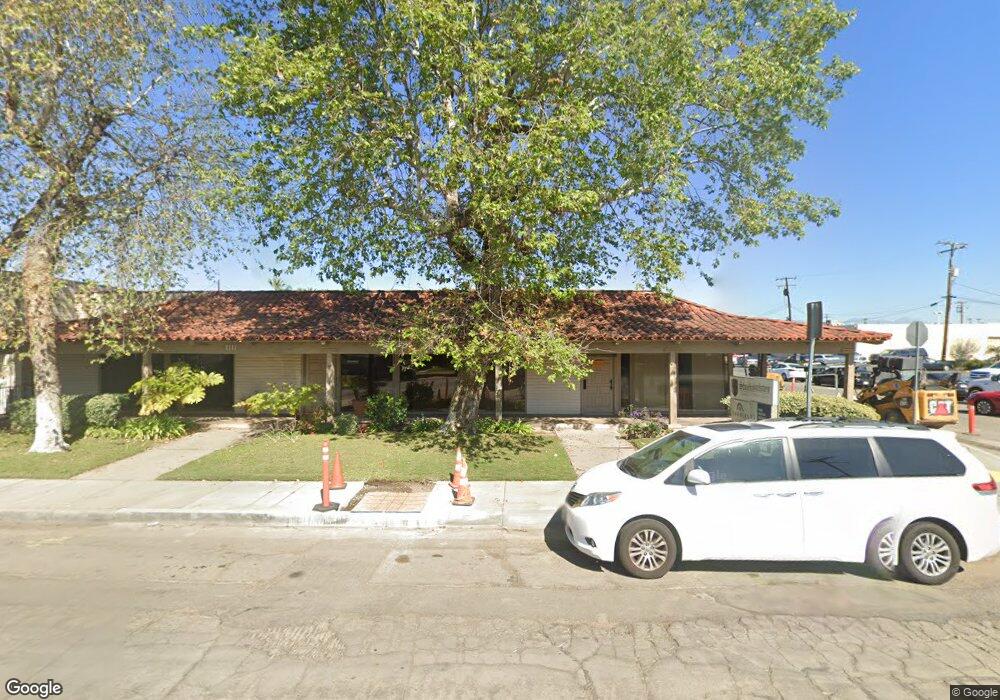
1111 E Commonwealth Ave Fullerton, CA 92831
Estimated Value: $2,132,375
Studio
--
Bath
6,368
Sq Ft
$335/Sq Ft
Est. Value
About This Home
This home is located at 1111 E Commonwealth Ave, Fullerton, CA 92831 and is currently estimated at $2,132,375, approximately $334 per square foot. 1111 E Commonwealth Ave is a home located in Orange County with nearby schools including Raymond Elementary School, Ladera Vista Junior High School, and Fullerton Union High School.
Ownership History
Date
Name
Owned For
Owner Type
Purchase Details
Closed on
May 18, 2016
Sold by
Offel Keith H and Offel Pamela L
Bought by
Lavamax Llc
Current Estimated Value
Home Financials for this Owner
Home Financials are based on the most recent Mortgage that was taken out on this home.
Original Mortgage
$580,000
Outstanding Balance
$460,967
Interest Rate
3.61%
Mortgage Type
Commercial
Estimated Equity
$1,671,408
Purchase Details
Closed on
Mar 27, 2002
Sold by
Blair Richard L and Blair Marilyn J
Bought by
Offel Keith H and Offel Pamela L
Home Financials for this Owner
Home Financials are based on the most recent Mortgage that was taken out on this home.
Original Mortgage
$340,000
Interest Rate
7.08%
Mortgage Type
Commercial
Create a Home Valuation Report for This Property
The Home Valuation Report is an in-depth analysis detailing your home's value as well as a comparison with similar homes in the area
Purchase History
| Date | Buyer | Sale Price | Title Company |
|---|---|---|---|
| Lavamax Llc | $1,160,000 | Lawyers Title | |
| Offel Keith H | $650,000 | South Coast Title |
Source: Public Records
Mortgage History
| Date | Status | Borrower | Loan Amount |
|---|---|---|---|
| Open | Lavamax Llc | $580,000 | |
| Previous Owner | Offel Keith H | $340,000 |
Source: Public Records
Tax History
| Year | Tax Paid | Tax Assessment Tax Assessment Total Assessment is a certain percentage of the fair market value that is determined by local assessors to be the total taxable value of land and additions on the property. | Land | Improvement |
|---|---|---|---|---|
| 2025 | $15,352 | $1,373,203 | $947,039 | $426,164 |
| 2024 | $15,352 | $1,346,278 | $928,470 | $417,808 |
| 2023 | $14,981 | $1,319,881 | $910,265 | $409,616 |
| 2022 | $14,881 | $1,294,001 | $892,416 | $401,585 |
| 2021 | $14,625 | $1,268,629 | $874,918 | $393,711 |
| 2020 | $14,545 | $1,255,621 | $865,947 | $389,674 |
| 2019 | $14,169 | $1,231,001 | $848,967 | $382,034 |
| 2018 | $13,956 | $1,206,864 | $832,320 | $374,544 |
| 2017 | $13,726 | $1,183,200 | $816,000 | $367,200 |
| 2016 | $9,663 | $811,155 | $508,537 | $302,618 |
| 2015 | $9,398 | $798,971 | $500,898 | $298,073 |
| 2014 | $9,131 | $783,321 | $491,086 | $292,235 |
Source: Public Records
Map
Nearby Homes
- 111 N Stanford Ave
- 1105 E Walnut Ave
- 151 N Lincoln Ave
- 705 E Santa fe Ave
- 1318 Victoria Dr Unit B
- 1330 Victoria Dr Unit C
- 16 Magnolia Viaduct
- 13 Palm Viaduct
- 1245 Riverside Dr
- 1001 Nutwood Ave
- 501 E Orangethorpe Ave Unit 31
- 34 Pine Viaduct
- 7 Pine Viaduct
- 47 Fir Viaduct
- 804 E Glenwood Ave
- 1740 E Commonwealth Ave Unit 101
- 1736 E Commonwealth Ave Unit 102
- 400 N Acacia Ave Unit B10
- 400 N Acacia Ave Unit A17
- 400 N Acacia Ave Unit C33
- 1111 E Commonwealth Ave Unit A
- 1101 E Commonwealth Ave
- 1108 E Commonwealth Ave
- 1110 E Commonwealth Ave
- 1104 E Commonwealth Ave
- 1112 E Commonwealth Ave
- 123 Stanford Ave
- 1102 E Commonwealth Ave
- 1116 E Commonwealth Ave
- 1011 E Commonwealth Ave
- 135 N Raymond Ave
- 111 N Raymond Ave
- 1122 E Commonwealth Ave
- 112 N Cornell Ave Unit B
- 110 N Cornell Ave
- 1005 E Commonwealth Ave
- 1107 Sudene Ave
- 1111 Sudene Ave
- 1103 Sudene Ave
- 116 N Cornell Ave
Your Personal Tour Guide
Ask me questions while you tour the home.