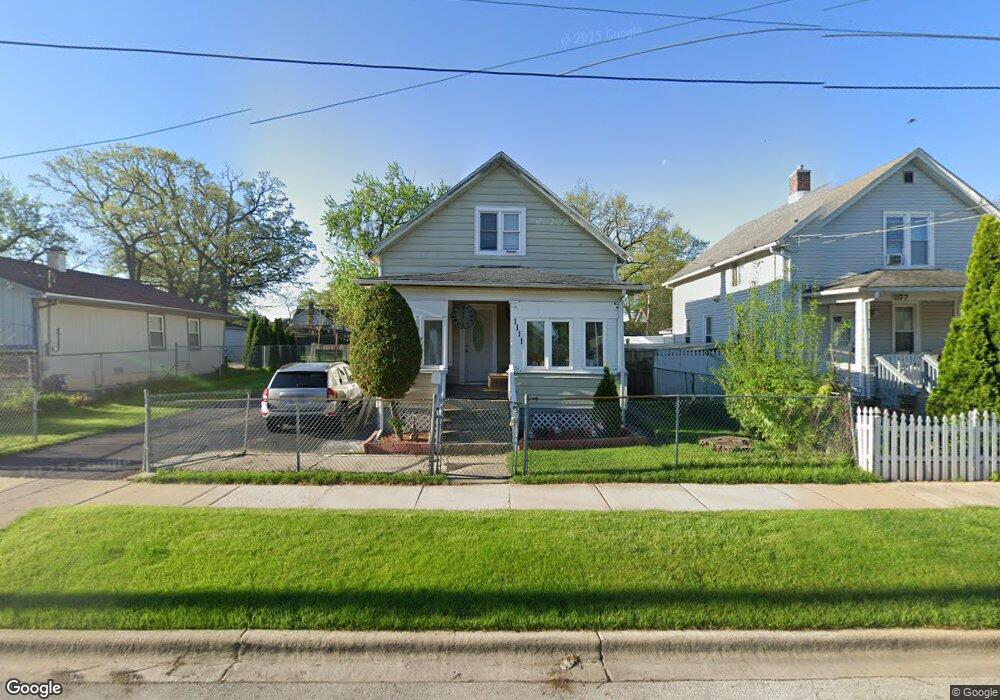
1111 Front St Aurora, IL 60505
Light of the Community NeighborhoodEstimated Value: $197,000 - $231,375
3
Beds
1
Bath
1,082
Sq Ft
$201/Sq Ft
Est. Value
About This Home
This home is located at 1111 Front St, Aurora, IL 60505 and is currently estimated at $217,844, approximately $201 per square foot. 1111 Front St is a home located in Kane County with nearby schools including Oak Park Elementary School, Henry W Cowherd Middle School, and East Aurora High School.
Ownership History
Date
Name
Owned For
Owner Type
Purchase Details
Closed on
Aug 14, 2003
Sold by
Vega Blanca E
Bought by
Mosqueda Francisco and Mosqueda Erendira M
Current Estimated Value
Home Financials for this Owner
Home Financials are based on the most recent Mortgage that was taken out on this home.
Original Mortgage
$118,000
Interest Rate
6.4%
Mortgage Type
FHA
Purchase Details
Closed on
Jul 26, 2000
Sold by
Associates Home Equity Services Inc
Bought by
Vega Blanca E
Purchase Details
Closed on
May 26, 2000
Sold by
Gutierrez
Bought by
Associates Home Equity Services Inc
Purchase Details
Closed on
Nov 30, 1994
Sold by
Zarris George A and Zarris Barbara
Bought by
Gutierrez Jose C and Gutierrez San Juanita
Home Financials for this Owner
Home Financials are based on the most recent Mortgage that was taken out on this home.
Original Mortgage
$62,910
Interest Rate
9.06%
Create a Home Valuation Report for This Property
The Home Valuation Report is an in-depth analysis detailing your home's value as well as a comparison with similar homes in the area
Home Values in the Area
Average Home Value in this Area
Purchase History
| Date | Buyer | Sale Price | Title Company |
|---|---|---|---|
| Mosqueda Francisco | $120,000 | Multiple | |
| Vega Blanca E | $61,125 | Stewart Title Company | |
| Associates Home Equity Services Inc | -- | -- | |
| Gutierrez Jose C | $70,000 | Equity Title |
Source: Public Records
Mortgage History
| Date | Status | Borrower | Loan Amount |
|---|---|---|---|
| Previous Owner | Mosqueda Francisco | $118,000 | |
| Previous Owner | Gutierrez Jose C | $62,910 |
Source: Public Records
Tax History Compared to Growth
Tax History
| Year | Tax Paid | Tax Assessment Tax Assessment Total Assessment is a certain percentage of the fair market value that is determined by local assessors to be the total taxable value of land and additions on the property. | Land | Improvement |
|---|---|---|---|---|
| 2024 | $3,372 | $57,182 | $8,589 | $48,593 |
| 2023 | $3,176 | $50,501 | $7,674 | $42,827 |
| 2022 | $3,027 | $45,836 | $7,002 | $38,834 |
| 2021 | $2,961 | $42,674 | $6,519 | $36,155 |
| 2020 | $2,797 | $39,638 | $6,055 | $33,583 |
| 2019 | $3,068 | $40,815 | $5,610 | $35,205 |
| 2018 | $2,787 | $36,603 | $5,189 | $31,414 |
| 2017 | $2,530 | $31,795 | $4,781 | $27,014 |
| 2016 | $2,279 | $27,661 | $4,098 | $23,563 |
| 2015 | -- | $23,996 | $3,524 | $20,472 |
| 2014 | -- | $22,928 | $3,239 | $19,689 |
| 2013 | -- | $24,743 | $3,095 | $21,648 |
Source: Public Records
Map
Nearby Homes
- 1105 Indian Ave
- 1038 Liberty St
- 226 N Ohio St
- 1147 Rural St Unit 41
- 257 Vermont Ave
- 1611 Indian Ave
- 1311 Kane St
- 172 N East Ave
- 608 Front St
- 131 N Kendall St
- 15 Hill Ave
- 574 E Galena Blvd
- 409 Dayward Ct
- 773 Aurora Ave
- 1671 Sheffer Rd
- 1900 E New York St
- 0000 N Farnsworth Ave
- 1009 Assell Ave
- 1771 Briarheath Dr
- 610 Four Seasons Blvd Unit A071