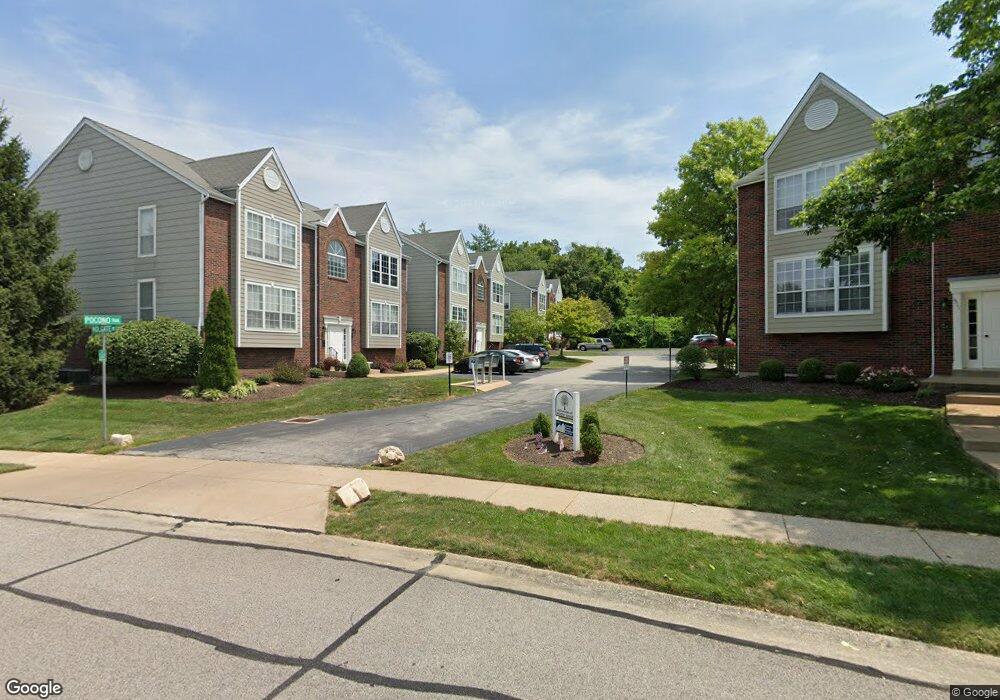
1111 Pocono Trail Unit C Ballwin, MO 63021
Estimated Value: $168,036 - $187,000
2
Beds
1
Bath
1,009
Sq Ft
$175/Sq Ft
Est. Value
About This Home
This home is located at 1111 Pocono Trail Unit C, Ballwin, MO 63021 and is currently estimated at $176,259, approximately $174 per square foot. 1111 Pocono Trail Unit C is a home located in St. Louis County with nearby schools including Valley Park Middle School, Al Manara Academy, and Twin Oaks Christian School.
Ownership History
Date
Name
Owned For
Owner Type
Purchase Details
Closed on
Oct 28, 2009
Sold by
Pace Justin R and Pace Ashley
Bought by
Mezera Amy K
Current Estimated Value
Home Financials for this Owner
Home Financials are based on the most recent Mortgage that was taken out on this home.
Original Mortgage
$100,360
Outstanding Balance
$65,433
Interest Rate
5.05%
Mortgage Type
FHA
Estimated Equity
$110,826
Purchase Details
Closed on
Jun 18, 2007
Sold by
Norman Alicia K
Bought by
Pace Justin R and Pace Ashley
Home Financials for this Owner
Home Financials are based on the most recent Mortgage that was taken out on this home.
Original Mortgage
$95,200
Interest Rate
6.37%
Mortgage Type
Purchase Money Mortgage
Purchase Details
Closed on
Feb 26, 2001
Sold by
Rjr Lewellen Larry
Bought by
Norman Alicia K
Home Financials for this Owner
Home Financials are based on the most recent Mortgage that was taken out on this home.
Original Mortgage
$83,576
Interest Rate
6.97%
Mortgage Type
FHA
Create a Home Valuation Report for This Property
The Home Valuation Report is an in-depth analysis detailing your home's value as well as a comparison with similar homes in the area
Home Values in the Area
Average Home Value in this Area
Purchase History
| Date | Buyer | Sale Price | Title Company |
|---|---|---|---|
| Mezera Amy K | $104,000 | Atc | |
| Pace Justin R | $119,000 | None Available | |
| Norman Alicia K | $85,500 | -- | |
| Norman Alicia K | -- | -- |
Source: Public Records
Mortgage History
| Date | Status | Borrower | Loan Amount |
|---|---|---|---|
| Open | Mezera Amy K | $100,360 | |
| Previous Owner | Pace Justin R | $95,200 | |
| Previous Owner | Norman Alicia K | $83,576 |
Source: Public Records
Tax History
| Year | Tax Paid | Tax Assessment Tax Assessment Total Assessment is a certain percentage of the fair market value that is determined by local assessors to be the total taxable value of land and additions on the property. | Land | Improvement |
|---|---|---|---|---|
| 2025 | $2,203 | $31,770 | $8,440 | $23,330 |
| 2024 | $2,203 | $27,130 | $3,460 | $23,670 |
| 2023 | $2,187 | $27,130 | $3,460 | $23,670 |
| 2022 | $2,126 | $23,830 | $4,790 | $19,040 |
| 2021 | $2,117 | $23,830 | $4,790 | $19,040 |
| 2020 | $1,967 | $21,110 | $4,220 | $16,890 |
| 2019 | $1,902 | $21,110 | $4,220 | $16,890 |
| 2018 | $1,670 | $18,220 | $2,680 | $15,540 |
| 2017 | $1,658 | $18,220 | $2,680 | $15,540 |
| 2016 | $1,611 | $16,650 | $3,060 | $13,590 |
Source: Public Records
Map
Nearby Homes
- 1327 Holgate Dr Unit C
- 1332 Holgate Dr Unit G5
- 1340 Holgate Dr Unit G3
- 1324 Boly Ln
- 1344 Highland Oaks Dr Unit A
- 1019 Pocono Trail
- 1211 Big Bend Rd
- 1323 Tahoe Valley Ct
- 1514 Birnamwood Trail Dr
- 1226 Cottagemill Dr
- 1051 Briarhurst Dr
- 149 Crescent Ave
- 1316 Westbrooke Terrace Dr
- 62 Boyd Ave
- 1057 Hidden Ridge Trail
- 1271 Cliffridge Ln
- 1537 Whispering Creek Dr Unit 24C
- 809 Crescent Ridge Dr
- 1503 Whispering Creek Dr
- 1450 Whispering Creek Dr Unit 5B
- 1111 Pocono Trail Unit D
- 1111 Pocono Trail Unit A
- 1111 Pocono Trail Unit B
- 1107 Pocono Trail Unit D
- 1107 Pocono Trail Unit A
- 1107 Pocono Trail Unit C
- 1107 Pocono Trail Unit B
- 1110 Pocono Trail Unit B
- 1110 Pocono Trail Unit D
- 1110 Pocono Trail Unit A
- 1110 Pocono Trail Unit C
- 1103 Pocono Trail Unit B
- 1103 Pocono Trail Unit C
- 1103 Pocono Trail Unit D
- 1103 Pocono Trail Unit A
- 1311 Holgate Dr Unit B
- 1311 Holgate Dr Unit C
- 1311 Holgate Dr Unit D
- 1311 Holgate Dr Unit A
- 1174 Big Bend Rd
Your Personal Tour Guide
Ask me questions while you tour the home.