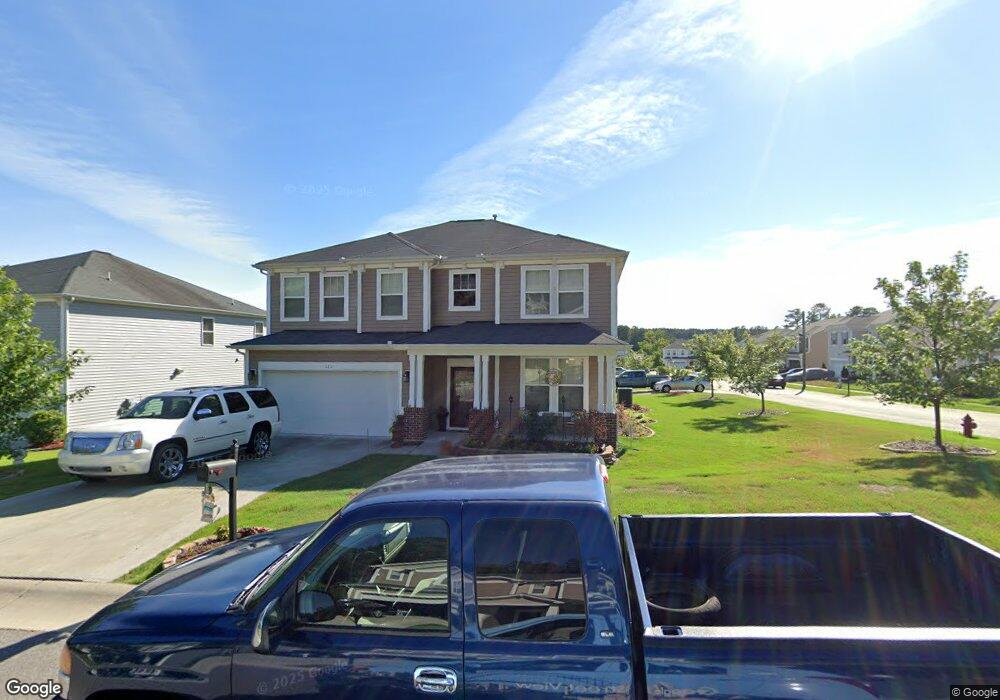
1111 Red Crest Ln Durham, NC 27704
Eastern Durham NeighborhoodEstimated Value: $376,235 - $422,000
3
Beds
3
Baths
2,353
Sq Ft
$167/Sq Ft
Est. Value
About This Home
This home is located at 1111 Red Crest Ln, Durham, NC 27704 and is currently estimated at $393,809, approximately $167 per square foot. 1111 Red Crest Ln is a home located in Durham County with nearby schools including Glenn Elementary, John W Neal Middle School, and Southern School of Energy & Sustainability.
Ownership History
Date
Name
Owned For
Owner Type
Purchase Details
Closed on
Jun 11, 2010
Sold by
Beazer Homes Corp
Bought by
Wooten Yolanda S and Parker Larry D
Current Estimated Value
Home Financials for this Owner
Home Financials are based on the most recent Mortgage that was taken out on this home.
Original Mortgage
$180,838
Outstanding Balance
$121,376
Interest Rate
5%
Mortgage Type
FHA
Estimated Equity
$272,433
Create a Home Valuation Report for This Property
The Home Valuation Report is an in-depth analysis detailing your home's value as well as a comparison with similar homes in the area
Home Values in the Area
Average Home Value in this Area
Purchase History
| Date | Buyer | Sale Price | Title Company |
|---|---|---|---|
| Wooten Yolanda S | $184,500 | None Available |
Source: Public Records
Mortgage History
| Date | Status | Borrower | Loan Amount |
|---|---|---|---|
| Open | Wooten Yolanda S | $180,838 |
Source: Public Records
Tax History Compared to Growth
Tax History
| Year | Tax Paid | Tax Assessment Tax Assessment Total Assessment is a certain percentage of the fair market value that is determined by local assessors to be the total taxable value of land and additions on the property. | Land | Improvement |
|---|---|---|---|---|
| 2025 | $3,309 | $434,377 | $73,750 | $360,627 |
| 2024 | $3,309 | $237,237 | $35,400 | $201,837 |
| 2023 | $3,108 | $237,237 | $35,400 | $201,837 |
| 2022 | $3,036 | $237,237 | $35,400 | $201,837 |
| 2021 | $3,022 | $237,237 | $35,400 | $201,837 |
| 2020 | $2,951 | $237,237 | $35,400 | $201,837 |
| 2019 | $2,951 | $237,237 | $35,400 | $201,837 |
| 2018 | $2,776 | $204,651 | $35,400 | $169,251 |
| 2017 | $2,756 | $204,651 | $35,400 | $169,251 |
| 2016 | $2,663 | $204,651 | $35,400 | $169,251 |
| 2015 | $2,736 | $197,664 | $36,006 | $161,658 |
| 2014 | $2,736 | $197,664 | $36,006 | $161,658 |
Source: Public Records
Map
Nearby Homes
- 1201 Opal Ln
- 1201 Opal Ln Unit 77
- 1212 Opal Ln
- 1213 Opal Ln Unit 80
- 1213 Opal Ln
- 1209 Opal Ln Unit 79
- 1209 Opal Ln
- 3721 Brightwood Ln
- 124 Rosebud Ln
- 1217 Golden Eagle Dr
- 608 Clearfield Dr
- 112 Eastern Teal Dr
- 721 Pebblestone Dr
- 1104 Pebblestone Dr
- 510 Cove Hollow Dr
- 509 Pebblestone Dr
- 512 Magna Dr
- 1828 Fletchers Chapel Rd
- 1717 Medallion Dr
- 2204 Fletchers Ridge Dr
- 1109 Red Crest Ln
- 108 Red Bird Dr
- 109 Red Bird Dr
- 106 Red Bird Dr
- 107 Red Bird Dr
- 1110 Red Crest Ln
- 1107 Red Crest Ln
- 111 Red Bird Dr
- 1108 Red Crest Ln
- 105 Red Bird Dr
- 201 Red Bird Dr
- 1106 Red Crest Ln
- 104 Red Bird Dr
- 103 Red Bird Dr
- 1106 Whispering Oak Ln
- 1104 Whispering Oak Ln
- 1110 Whispering Oak Ln
- 102 Red Bird Dr
- 8 Serenity Ct
- 6 Serenity Ct