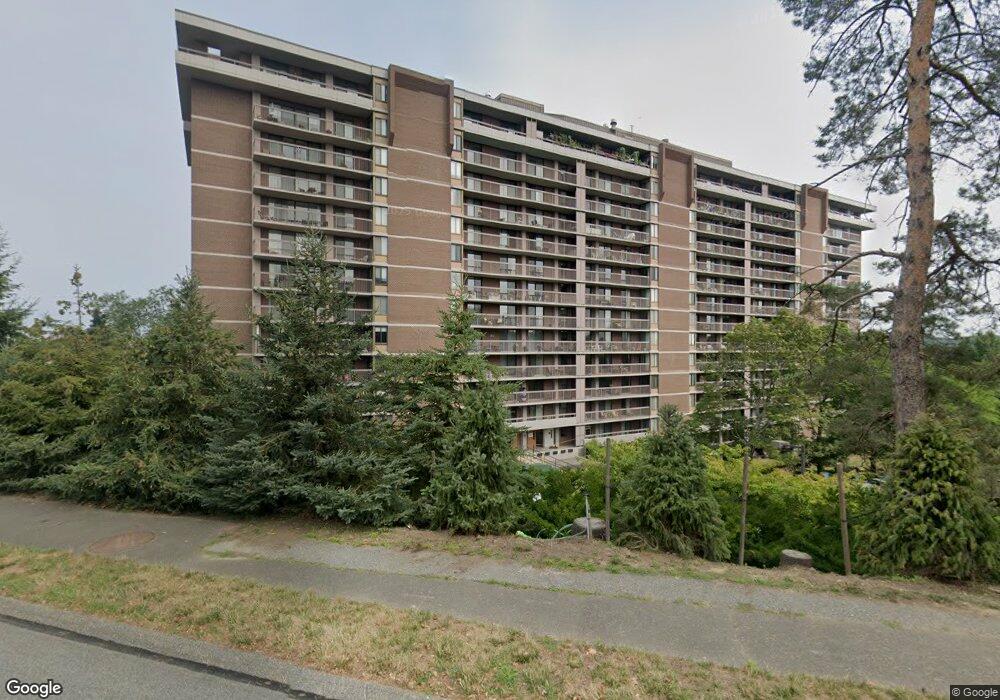
1112 Ferncroft Towers Danvers, MA 01923
Estimated Value: $528,126 - $556,000
2
Beds
2
Baths
1,531
Sq Ft
$354/Sq Ft
Est. Value
About This Home
This home is located at 1112 Ferncroft Towers, Danvers, MA 01923 and is currently estimated at $542,282, approximately $354 per square foot. 1112 Ferncroft Towers is a home located in Essex County with nearby schools including Howe-Manning Elementary School, Fuller Meadow Elementary School, and Masconomet Regional Middle School.
Ownership History
Date
Name
Owned For
Owner Type
Purchase Details
Closed on
Nov 11, 2021
Sold by
Dort Carol and Dort Clarence
Bought by
Adelle Abdallah Irt
Current Estimated Value
Purchase Details
Closed on
Jun 28, 2018
Sold by
Ambrose George C and Ambrose Gregory P
Bought by
Dort Carol and Dort Clarence
Home Financials for this Owner
Home Financials are based on the most recent Mortgage that was taken out on this home.
Original Mortgage
$165,000
Interest Rate
4.6%
Mortgage Type
New Conventional
Purchase Details
Closed on
Jun 30, 2008
Sold by
Ambrose Mary C
Bought by
Doyle Noreen P
Purchase Details
Closed on
Oct 18, 1995
Sold by
Isenberg Israel and Isenberg Dorothy
Bought by
Ambrose George C and Ambrose Mary
Create a Home Valuation Report for This Property
The Home Valuation Report is an in-depth analysis detailing your home's value as well as a comparison with similar homes in the area
Home Values in the Area
Average Home Value in this Area
Purchase History
| Date | Buyer | Sale Price | Title Company |
|---|---|---|---|
| Adelle Abdallah Irt | $450,000 | None Available | |
| Adelle Abdallah Irt | $450,000 | None Available | |
| Dort Carol | $322,500 | -- | |
| Dort Carol | $322,500 | -- | |
| Doyle Noreen P | -- | -- | |
| Doyle Noreen P | -- | -- | |
| Ambrose George C | $120,000 | -- | |
| Ambrose George C | $120,000 | -- |
Source: Public Records
Mortgage History
| Date | Status | Borrower | Loan Amount |
|---|---|---|---|
| Previous Owner | Dort Carol | $165,000 | |
| Previous Owner | Ambrose George C | $140,000 | |
| Previous Owner | Ambrose George C | $48,000 |
Source: Public Records
Tax History Compared to Growth
Tax History
| Year | Tax Paid | Tax Assessment Tax Assessment Total Assessment is a certain percentage of the fair market value that is determined by local assessors to be the total taxable value of land and additions on the property. | Land | Improvement |
|---|---|---|---|---|
| 2025 | $5,006 | $421,000 | $0 | $421,000 |
| 2024 | $5,190 | $440,200 | $0 | $440,200 |
| 2023 | $5,574 | $433,100 | $0 | $433,100 |
| 2022 | $5,385 | $406,400 | $0 | $406,400 |
| 2021 | $4,283 | $312,200 | $0 | $312,200 |
| 2020 | $4,135 | $303,600 | $0 | $303,600 |
| 2019 | $3,866 | $282,400 | $0 | $282,400 |
| 2018 | $3,912 | $280,200 | $0 | $280,200 |
| 2017 | $3,934 | $282,000 | $0 | $282,000 |
| 2016 | $3,859 | $277,800 | $0 | $277,800 |
| 2015 | -- | $254,900 | $0 | $254,900 |
Source: Public Records
Map
Nearby Homes
- 40 Village Rd Unit 1508
- 40 Village Rd Unit 1601
- 40 Village Rd Unit 608B
- 38 Village Rd Unit 515
- 36 Village Rd Unit 713
- 36 Village Rd Unit 712
- 36 Village Rd Unit 601
- 281 Rowley Bridge Rd Unit 7
- 200 North St
- 22 Locust St
- 6 Masi Meadow Ln Unit B
- 8 Lebeau Dr
- 33 Reservoir Dr
- 19 Bridle Spur Ln
- 1 Deacon Dr
- 41 Mohawk St
- 34 Kenney Rd
- 78 North St
- 26 Mohawk St
- 100 Kirkbride Dr Unit 119
- 1111 Ferncroft Towers
- 1110 Ferncroft Towers
- 1109 Ferncroft Towers
- 1108 Ferncroft Towers
- 1107 Ferncroft Towers
- 1106 Ferncroft Towers
- 1105 Ferncroft Towers
- 1104 Ferncroft Towers
- 1103 Ferncroft Towers
- 1102 Ferncroft Towers
- 1101 Ferncroft Towers
- 1211 Ferncroft Towers
- 1210 Ferncroft Towers
- 1209 Ferncroft Towers
- 1208 Ferncroft Towers
- 1207 Ferncroft Towers
- 1206 Ferncroft Towers
- 1205 Ferncroft Towers
- 1204 Ferncroft Towers
- 1203 Ferncroft Towers