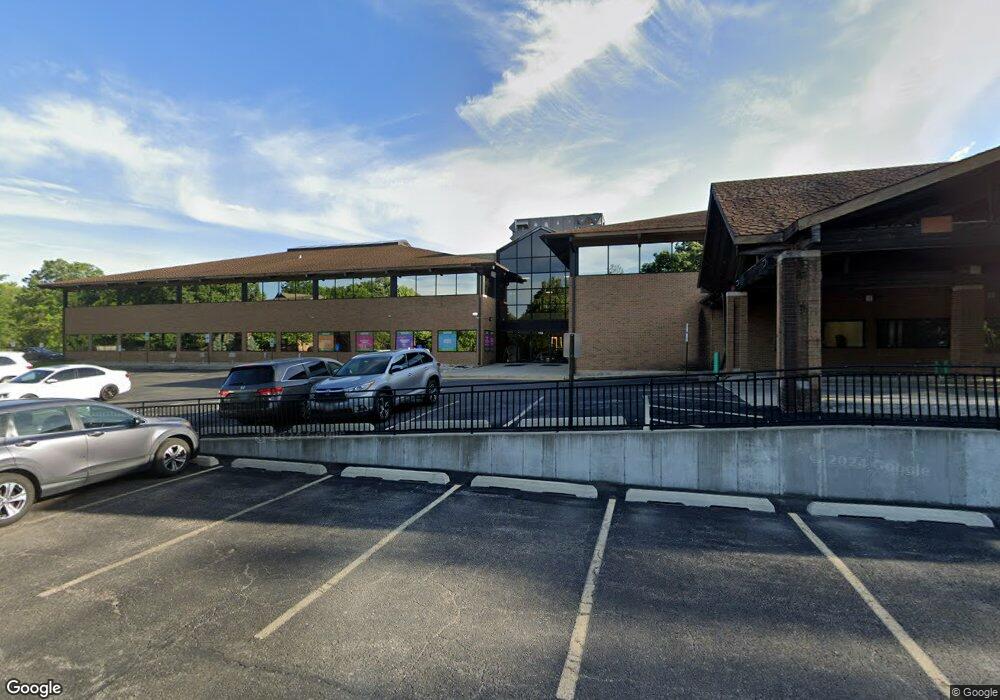
1112 S Washington St Naperville, IL 60540
Hobson Village Neighborhood
--
Bed
--
Bath
--
Sq Ft
--
Built
About This Home
This home is located at 1112 S Washington St, Naperville, IL 60540. 1112 S Washington St is a home located in DuPage County with nearby schools including Elmwood Elementary School, Lincoln Jr. High School, and Naperville Central High School.
Ownership History
Date
Name
Owned For
Owner Type
Purchase Details
Closed on
Oct 18, 2013
Sold by
Mfc Company Inc
Bought by
Cedar Street Capital Iv Llc
Home Financials for this Owner
Home Financials are based on the most recent Mortgage that was taken out on this home.
Original Mortgage
$2,662,500
Interest Rate
4.25%
Mortgage Type
Commercial
Purchase Details
Closed on
Jun 10, 2013
Sold by
Veluchamy Arun K and Veluchamy Arun R
Bought by
Mfc Company
Purchase Details
Closed on
Jan 31, 2006
Sold by
Mutual Bank
Bought by
Arun & Anu Naperville Llc
Home Financials for this Owner
Home Financials are based on the most recent Mortgage that was taken out on this home.
Original Mortgage
$4,387,500
Interest Rate
6.37%
Mortgage Type
Commercial
Purchase Details
Closed on
Apr 30, 2003
Sold by
Greatbanc Trust Co
Bought by
Security Bank Of Dupage
Create a Home Valuation Report for This Property
The Home Valuation Report is an in-depth analysis detailing your home's value as well as a comparison with similar homes in the area
Home Values in the Area
Average Home Value in this Area
Purchase History
| Date | Buyer | Sale Price | Title Company |
|---|---|---|---|
| Cedar Street Capital Iv Llc | $3,631,500 | None Available | |
| Mfc Company | -- | None Available | |
| Arun & Anu Naperville Llc | $5,300,000 | Ctic | |
| Security Bank Of Dupage | $2,336,500 | Ctic |
Source: Public Records
Mortgage History
| Date | Status | Borrower | Loan Amount |
|---|---|---|---|
| Closed | Cedar Street Capital Iv Llc | $2,662,500 | |
| Previous Owner | Arun & Anu Naperville Llc | $4,387,500 |
Source: Public Records
Tax History Compared to Growth
Tax History
| Year | Tax Paid | Tax Assessment Tax Assessment Total Assessment is a certain percentage of the fair market value that is determined by local assessors to be the total taxable value of land and additions on the property. | Land | Improvement |
|---|---|---|---|---|
| 2024 | $83,866 | $1,368,990 | $636,832 | $732,158 |
| 2023 | $81,186 | $1,249,420 | $581,210 | $668,210 |
| 2022 | $80,861 | $1,249,420 | $581,210 | $668,210 |
| 2021 | $84,049 | $1,294,860 | $559,230 | $735,630 |
| 2020 | $67,769 | $1,046,800 | $559,230 | $487,570 |
| 2019 | $65,620 | $996,950 | $533,120 | $463,830 |
| 2018 | $75,798 | $1,151,250 | $533,070 | $618,180 |
| 2017 | $72,465 | $1,083,640 | $515,090 | $568,550 |
| 2016 | $79,491 | $1,167,040 | $497,210 | $669,830 |
| 2015 | $84,091 | $1,166,550 | $467,790 | $698,760 |
| 2014 | $83,047 | $1,115,730 | $467,790 | $647,940 |
| 2013 | $90,658 | $1,239,700 | $468,910 | $770,790 |
Source: Public Records
Map
Nearby Homes
- 165 Tamarack Ave
- 908 Julian Ct
- 616 Driftwood Ct
- 821 Wellner Rd
- 923 Tim Tam Cir
- 706 S Loomis St Unit D
- 325 Pine Ct
- 425 W Gartner Rd
- 907 Secretariat Dr
- 31 Golden Larch Ct
- 132 Robin Hill Dr
- 225 Elmwood Dr
- 845 Tulip Ln
- 1408 Swallow St
- 344 Waxwing Ave
- 820 Prairie Ave
- 316 Hemlock Ln
- 911 Lilac Ln Unit 9
- 1443 Meander Dr
- 488 S Columbia St
- 1156 S Washington St
- 1152 S Washington St
- 1120 S Washington St
- 1148 S Washington St
- 1136 S Washington St
- 1140 S Washington St
- 1144 S Washington St
- 1132 S Washington St
- 1128 S Washington St
- 4 Olympus Dr
- 1132 Edgewater Dr
- 1124 S Washington St
- 1128 Edgewater Dr
- 1116 S Washington St
- 1155 S Washington St Unit 101
- 1155 S Washington St Unit 300
- 1155 S Washington St
- 8 Olympus Dr
- 1111 S Washington St
- 1124 Edgewater Dr