1114 Cedar Gables Dr Unit 8 San Jose, CA 95118
Valley View-Reed NeighborhoodEstimated Value: $518,000 - $590,000
About This Home
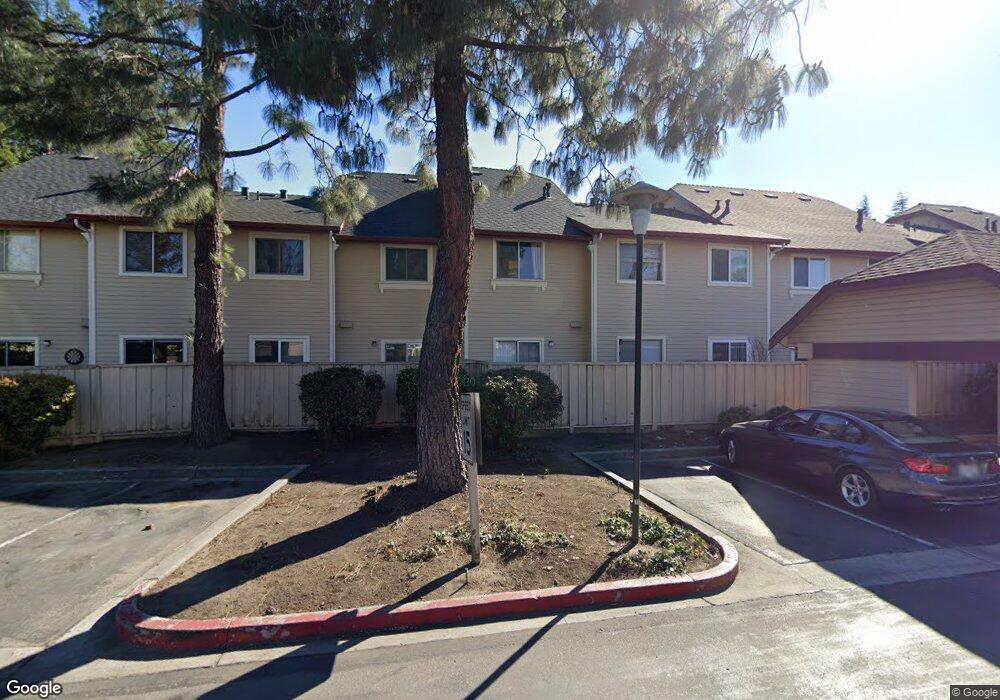
This home is located at 1114 Cedar Gables Dr Unit 8, San Jose, CA 95118 and is currently estimated at $556,944, approximately $675 per square foot. 1114 Cedar Gables Dr Unit 8 is a home located in Santa Clara County with nearby schools including Almaden Elementary School, John Muir Middle School, and Pioneer High School.
Ownership History
We collect this data history from publicly available records. To have your information removed, we recommend requesting removal directly through your county’s website.
Purchase Details
Home Financials for this Owner
Home Financials are based on the most recent Mortgage that was taken out on this home.Purchase Details
Home Financials for this Owner
Home Financials are based on the most recent Mortgage that was taken out on this home.Home Values in the Area
Average Home Value in this Area
Purchase History
We collect this data history from publicly available records. To have your information removed, we recommend requesting removal directly through your county’s website.
| Date | Buyer | Sale Price | Title Company |
|---|---|---|---|
| $97,500 | Alliance Title Company | ||
| $202,000 | Fidelity National Title Co | ||
| -- | Fidelity National Title Co | ||
| -- | Fidelity National Title Co |
Mortgage History
We collect this data history from publicly available records. To have your information removed, we recommend requesting removal directly through your county’s website.
| Date | Status | Borrower | Loan Amount |
|---|---|---|---|
| Open | $195,000 | ||
| Closed | $181,800 |
Tax History
We collect this data history from publicly available records. To have your information removed, we recommend requesting removal directly through your county’s website.
| Year | Tax Paid | Tax Assessment Tax Assessment Total Assessment is a certain percentage of the fair market value that is determined by local assessors to be the total taxable value of land and additions on the property. | Land | Improvement |
|---|---|---|---|---|
| 2025 | $4,711 | $359,801 | $182,482 | $177,319 |
| 2024 | $4,711 | $352,747 | $178,904 | $173,843 |
| 2023 | $4,616 | $345,832 | $175,397 | $170,435 |
| 2022 | $4,595 | $339,052 | $171,958 | $167,094 |
| 2021 | $4,505 | $332,405 | $168,587 | $163,818 |
| 2020 | $4,433 | $328,998 | $166,859 | $162,139 |
| 2019 | $4,351 | $322,548 | $163,588 | $158,960 |
| 2018 | $4,312 | $316,225 | $160,381 | $155,844 |
| 2017 | $4,278 | $310,026 | $157,237 | $152,789 |
| 2016 | $4,151 | $303,948 | $154,154 | $149,794 |
| 2015 | $4,118 | $299,383 | $151,839 | $147,544 |
| 2014 | $4,036 | $293,519 | $148,865 | $144,654 |
Map
- 1066 Cedar Gables Dr
- 4970 Cherry Ave Unit 203
- 4970 Cherry Ave Unit 211
- 4970 Cherry Ave Unit 212
- 4477 George Oaks Dr
- 4967 Cherry Ave
- 1163 Cherryview Ln
- 1109 Lynhurst Way
- 1314 Shawn Dr Unit 1
- 1318 Joplin Dr Unit 4
- 1325 Joplin Dr Unit 2
- 4276 Lynfield Ln
- 1275 Bryan Ave
- 1345 Joplin Dr Unit 2
- 4807 Capay Dr Unit 1
- 4563 Huntington Ln
- 4735 Capay Dr Unit 1
- 3900 Thousand Oaks Dr
- 4716 Capay Dr Unit 3
- 4972 Minas Dr
- 1112 Cedar Gables Dr
- 1126 Cedar Gables Dr
- 1106 Cedar Gables Dr
- 1118 Cedar Gables Dr
- 1116 Cedar Gables Dr
- 1110 Cedar Gables Dr
- 1108 Cedar Gables Dr
- 1120 Cedar Gables Dr
- 1122 Cedar Gables Dr
- 1104 Cedar Gables Dr
- 1124 Cedar Gables Dr
- 1058 Cedar Gables Dr
- 1098 Cedar Gables Dr
- 1064 Cedar Gables Dr
- 1070 Cedar Gables Dr
- 1068 Cedar Gables Dr
- 1062 Cedar Gables Dr Unit 50
- 1060 Cedar Gables Dr
- 1074 Cedar Gables Dr
- 1072 Cedar Gables Dr
Ask me questions while you tour the home.