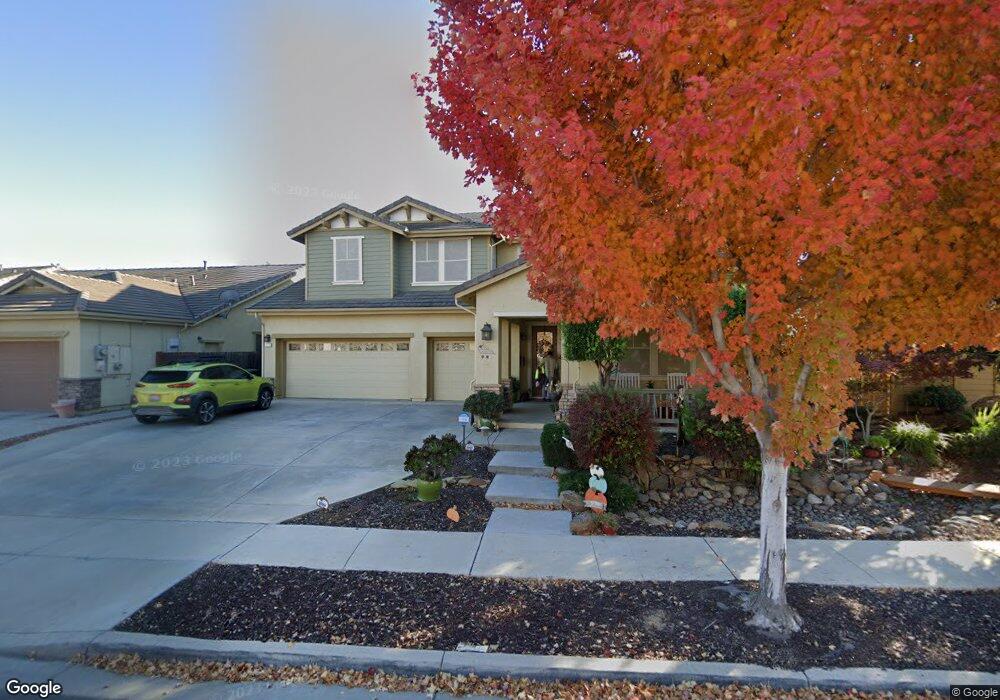
1114 Gaugin Way Patterson, CA 95363
Estimated Value: $609,000 - $646,000
5
Beds
4
Baths
3,138
Sq Ft
$197/Sq Ft
Est. Value
About This Home
This home is located at 1114 Gaugin Way, Patterson, CA 95363 and is currently estimated at $618,577, approximately $197 per square foot. 1114 Gaugin Way is a home located in Stanislaus County with nearby schools including Apricot Valley Elementary School, Creekside Middle School, and Patterson High School.
Ownership History
Date
Name
Owned For
Owner Type
Purchase Details
Closed on
Jun 4, 2020
Sold by
Mora Torres Manuel
Bought by
Mora Filomena C
Current Estimated Value
Home Financials for this Owner
Home Financials are based on the most recent Mortgage that was taken out on this home.
Original Mortgage
$380,000
Interest Rate
3.2%
Mortgage Type
New Conventional
Purchase Details
Closed on
Apr 27, 2020
Sold by
Mendoza Colleen R
Bought by
Mora Moises A and Tibbitts Jeremy M
Home Financials for this Owner
Home Financials are based on the most recent Mortgage that was taken out on this home.
Original Mortgage
$380,000
Interest Rate
3.2%
Mortgage Type
New Conventional
Purchase Details
Closed on
Sep 12, 2005
Sold by
Wl Patterson D2 Associates Llc
Bought by
Mendoza Romeo B and Mendoza Colleen R
Home Financials for this Owner
Home Financials are based on the most recent Mortgage that was taken out on this home.
Original Mortgage
$391,450
Interest Rate
5.75%
Mortgage Type
Fannie Mae Freddie Mac
Create a Home Valuation Report for This Property
The Home Valuation Report is an in-depth analysis detailing your home's value as well as a comparison with similar homes in the area
Home Values in the Area
Average Home Value in this Area
Purchase History
| Date | Buyer | Sale Price | Title Company |
|---|---|---|---|
| Mora Filomena C | -- | Fidelity National Title Co | |
| Mora Moises A | $490,000 | Fidelity National Title Co | |
| Mendoza Romeo B | $489,500 | First American Title Co |
Source: Public Records
Mortgage History
| Date | Status | Borrower | Loan Amount |
|---|---|---|---|
| Previous Owner | Mora Moises A | $380,000 | |
| Previous Owner | Mendoza Romeo B | $391,450 |
Source: Public Records
Tax History
| Year | Tax Paid | Tax Assessment Tax Assessment Total Assessment is a certain percentage of the fair market value that is determined by local assessors to be the total taxable value of land and additions on the property. | Land | Improvement |
|---|---|---|---|---|
| 2025 | $10,026 | $535,883 | $103,895 | $431,988 |
| 2024 | $9,903 | $525,376 | $101,858 | $423,518 |
| 2023 | $9,839 | $515,075 | $99,861 | $415,214 |
| 2022 | $9,354 | $504,976 | $97,903 | $407,073 |
| 2021 | $9,216 | $495,076 | $95,984 | $399,092 |
| 2020 | $8,314 | $425,000 | $95,000 | $330,000 |
| 2019 | $8,260 | $425,000 | $95,000 | $330,000 |
| 2018 | $7,866 | $405,000 | $95,000 | $310,000 |
| 2017 | $7,758 | $386,000 | $70,000 | $316,000 |
| 2016 | $7,174 | $333,000 | $70,000 | $263,000 |
| 2015 | $7,117 | $332,000 | $41,500 | $290,500 |
| 2014 | $6,933 | $319,000 | $40,000 | $279,000 |
Source: Public Records
Map
Nearby Homes
- 1117 Van Gogh Ln
- 209 Fall Ave
- 191 Fall Ave
- 1008 Summer Ln
- 357 Wolfpack Ct
- 1265 Fawn Lily Dr
- 849 Miraggio Dr
- 1132 Marsh Wren Ct
- 1127 Kestrel Dr
- 708 Bonneau Ct
- 15707 S 9th St
- 1512 Marigold Dr
- 204 Daylily Ln
- 855 Toyon Ln
- 1413 Angus St
- 158 Charbray Ct
- 256 Birch Ranch Way
- 409 Osprey Dr
- 433 Sanderling Dr
- 2105 Emerald Ranch Rd
- 1110 Gaugin Way
- 1118 Gaugin Way
- 1117 Van Gogh Ln Unit 3
- 1113 Van Gogh Ln
- 1122 Gaugin Way
- 1121 Van Gogh Ln
- 1109 Van Gogh Ln
- 1106 Gaugin Way
- 1109 Gaugin Way
- 1113 Gaugin Way
- 1105 Gaugin Way
- 1117 Gaugin Way
- 1105 Van Gogh Ln
- 1125 Van Gogh Ln
- 1126 Gaugin Way
- 1121 Gaugin Way
- 200 Monet Way
- 194 Monet Way
- 1101 Van Gogh Ln
- 1125 Gaugin Way
Your Personal Tour Guide
Ask me questions while you tour the home.