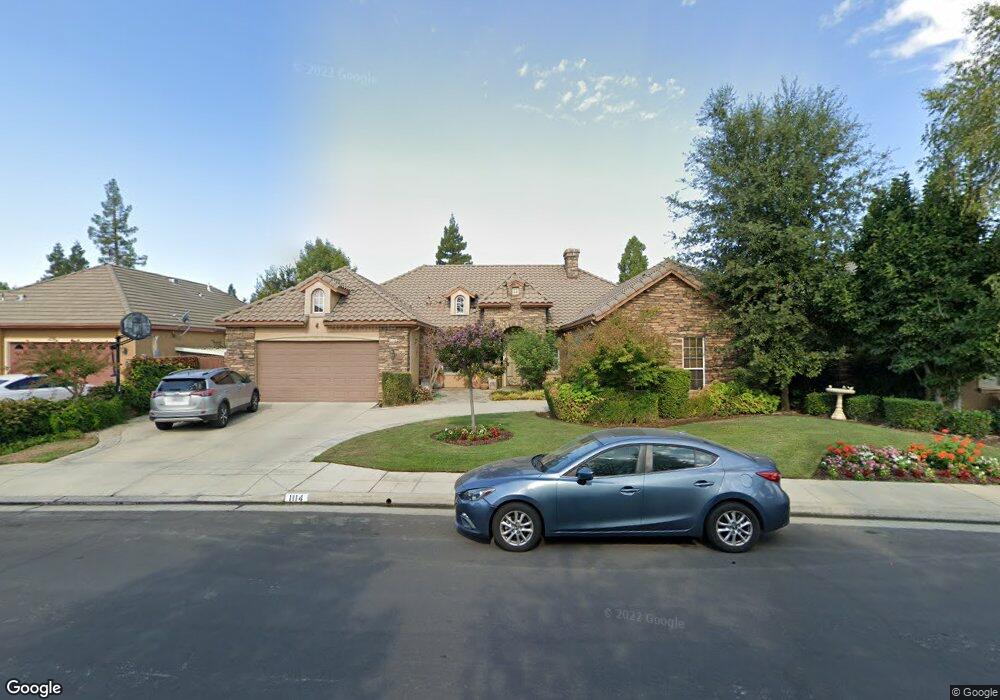
1114 N Orangewood Ave Clovis, CA 93611
Estimated Value: $750,962 - $870,000
3
Beds
3
Baths
2,876
Sq Ft
$288/Sq Ft
Est. Value
About This Home
This home is located at 1114 N Orangewood Ave, Clovis, CA 93611 and is currently estimated at $829,654, approximately $288 per square foot. 1114 N Orangewood Ave is a home located in Fresno County with nearby schools including Garfield Elementary School, Alta Sierra Intermediate School, and Buchanan High School.
Ownership History
Date
Name
Owned For
Owner Type
Purchase Details
Closed on
Jul 27, 2010
Sold by
Mccurley Robert W and Mccurley Erin E
Bought by
Dana Stephen D and Arbios Theresa
Current Estimated Value
Home Financials for this Owner
Home Financials are based on the most recent Mortgage that was taken out on this home.
Original Mortgage
$381,085
Outstanding Balance
$254,596
Interest Rate
4.75%
Mortgage Type
FHA
Estimated Equity
$575,058
Purchase Details
Closed on
Aug 30, 2006
Sold by
Mccurley Robert and Mccurley Erin
Bought by
Mccurley Robert W and Mccurley Erin E
Purchase Details
Closed on
Sep 18, 2001
Sold by
Leo Wilson Co Inc
Bought by
Mccurley Robert and Mccurley Erin
Home Financials for this Owner
Home Financials are based on the most recent Mortgage that was taken out on this home.
Original Mortgage
$271,600
Interest Rate
6.99%
Create a Home Valuation Report for This Property
The Home Valuation Report is an in-depth analysis detailing your home's value as well as a comparison with similar homes in the area
Home Values in the Area
Average Home Value in this Area
Purchase History
| Date | Buyer | Sale Price | Title Company |
|---|---|---|---|
| Dana Stephen D | $400,000 | Fidelity National Title Co | |
| Mccurley Robert W | -- | None Available | |
| Mccurley Robert | $339,500 | Financial Title Company |
Source: Public Records
Mortgage History
| Date | Status | Borrower | Loan Amount |
|---|---|---|---|
| Open | Dana Stephen D | $381,085 | |
| Previous Owner | Mccurley Robert | $271,600 |
Source: Public Records
Tax History
| Year | Tax Paid | Tax Assessment Tax Assessment Total Assessment is a certain percentage of the fair market value that is determined by local assessors to be the total taxable value of land and additions on the property. | Land | Improvement |
|---|---|---|---|---|
| 2025 | $6,265 | $512,456 | $128,110 | $384,346 |
| 2023 | $6,020 | $492,559 | $123,137 | $369,422 |
| 2022 | $5,943 | $482,902 | $120,723 | $362,179 |
| 2021 | $5,771 | $473,434 | $118,356 | $355,078 |
| 2020 | $5,749 | $468,581 | $117,143 | $351,438 |
| 2019 | $5,641 | $459,395 | $114,847 | $344,548 |
| 2018 | $5,517 | $450,389 | $112,596 | $337,793 |
| 2017 | $5,426 | $441,559 | $110,389 | $331,170 |
| 2016 | $5,240 | $432,902 | $108,225 | $324,677 |
| 2015 | $5,149 | $426,401 | $106,600 | $319,801 |
| 2014 | $5,049 | $418,049 | $104,512 | $313,537 |
Source: Public Records
Map
Nearby Homes
- 957 N Citadel Ave
- 166 Bedford Ave
- 450 W Alluvial Ave
- 484 W Balsam Ln
- 334 Vermont Ave
- 684 W Chennault Ave
- 290 W Loyola Ave
- 602 W Mahogany Ln
- 2991 E Cromwell Ave
- 351 N Peach Ave
- 2845 E Goshen Ave
- 77 W Lester Ave
- 1879 N Harvard Ave
- 288 W Magill Ave
- 1691 N Monaco Ln
- 754 W Riviera Ln
- 2878 E Omaha Ave
- 1303 Jordan Ave
- 2825 E Quincy Ave
- 1929 N Harvard Ave
- 1134 N Orangewood Ave
- 1094 N Orangewood Ave
- 1091 N Homsy Ave
- 1081 N Homsy Ave
- 1111 N Homsy Ave
- 1154 N Orangewood Ave
- 1074 N Orangewood Ave
- 164 W Houston Ave
- 165 W Wyndover Ave
- 1071 N Homsy Ave
- 1131 N Homsy Ave
- 1061 N Homsy Ave
- 1164 N Orangewood Ave
- 1054 N Orangewood Ave
- 155 W Wyndover Ave
- 154 W Houston Ave
- 1141 N Homsy Ave
- 1051 N Homsy Ave
- 160 W Wyndover Ave
- 1090 N Homsy Ave
Your Personal Tour Guide
Ask me questions while you tour the home.