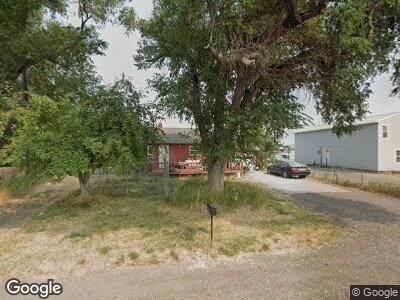
1115 Island Park Rd Billings, MT 59101
Lockwood NeighborhoodEstimated Value: $144,000 - $224,340
1
Bed
1
Bath
1,232
Sq Ft
$152/Sq Ft
Est. Value
About This Home
This home is located at 1115 Island Park Rd, Billings, MT 59101 and is currently estimated at $187,585, approximately $152 per square foot. 1115 Island Park Rd is a home located in Yellowstone County with nearby schools including Lockwood Primary School, Lockwood Intermediate School, and Lockwood Middle School.
Ownership History
Date
Name
Owned For
Owner Type
Purchase Details
Closed on
Sep 21, 2015
Sold by
J&W Property Development Llc
Bought by
Jacobs Vance
Current Estimated Value
Home Financials for this Owner
Home Financials are based on the most recent Mortgage that was taken out on this home.
Original Mortgage
$90,400
Outstanding Balance
$72,430
Interest Rate
3.86%
Mortgage Type
New Conventional
Estimated Equity
$124,947
Purchase Details
Closed on
Jan 13, 2015
Sold by
Montana Board Of Housing
Bought by
J & W Property Development Llc
Purchase Details
Closed on
May 28, 2014
Sold by
Meehan Edward J
Bought by
Montana Board Of Housing
Purchase Details
Closed on
Jun 12, 2005
Sold by
Peters Daniel M
Bought by
Meehan Edward J
Home Financials for this Owner
Home Financials are based on the most recent Mortgage that was taken out on this home.
Original Mortgage
$5,000
Interest Rate
5.55%
Mortgage Type
Unknown
Create a Home Valuation Report for This Property
The Home Valuation Report is an in-depth analysis detailing your home's value as well as a comparison with similar homes in the area
Home Values in the Area
Average Home Value in this Area
Purchase History
| Date | Buyer | Sale Price | Title Company |
|---|---|---|---|
| Jacobs Vance | -- | Chicago Title | |
| J & W Property Development Llc | -- | Amercian Title & Escrow | |
| Montana Board Of Housing | -- | None Available | |
| Meehan Edward J | -- | St |
Source: Public Records
Mortgage History
| Date | Status | Borrower | Loan Amount |
|---|---|---|---|
| Open | Jacobs Vance | $90,400 | |
| Previous Owner | Meehan Edward J | $5,000 | |
| Previous Owner | Meehan Edward J | $67,900 |
Source: Public Records
Tax History Compared to Growth
Tax History
| Year | Tax Paid | Tax Assessment Tax Assessment Total Assessment is a certain percentage of the fair market value that is determined by local assessors to be the total taxable value of land and additions on the property. | Land | Improvement |
|---|---|---|---|---|
| 2024 | $1,909 | $184,300 | $35,462 | $148,838 |
| 2023 | $1,891 | $184,300 | $35,462 | $148,838 |
| 2022 | $1,778 | $151,100 | $0 | $0 |
| 2021 | $1,756 | $151,100 | $0 | $0 |
| 2020 | $1,643 | $140,200 | $0 | $0 |
| 2019 | $1,671 | $140,200 | $0 | $0 |
| 2018 | $1,531 | $118,500 | $0 | $0 |
| 2017 | $887 | $118,500 | $0 | $0 |
| 2016 | $1,117 | $107,800 | $0 | $0 |
| 2015 | $1,042 | $101,800 | $0 | $0 |
| 2014 | $921 | $46,799 | $0 | $0 |
Source: Public Records
Map
Nearby Homes
- 843 Joyce Cir
- 114 Lantana Dr
- 5236 Old Hardin Rd
- 1803 U S Highway 87 E Unit 14
- TBD Old Hardin Rd
- 570 Killarney St
- 441 Shamrock Ln
- 230 Alta Vista Ave
- Lot 4 Bench Blvd
- 1224 Cherry Island Dr
- 1252 Timbers Blvd
- 18 Prince Charles Dr
- 1224 Dublin St
- 736 Shamrock Ln
- 1145 Hemingway Ave
- 0000 Cherry Island Dr
- 409 Kuhlman Dr
- 809 Ahoy Ave
- 1036 Competition Ave
- 1104 Competition Ave
- 1115 Island Park Rd
- 270 Bonnie Ln
- 1107 Island Park Rd
- 288 Bonnie Ln
- 236 Lomond Ln
- 354 Bonnie Ln
- 1007 Island Park Rd
- 366 Bonnie Ln
- 409 Bonnie Ln
- 401 Bonnie Ln
- 1112 Doon Ave
- 418 Lomond Ln
- Blk 2 Lot 11 Bonnie Ln
- 0 Doon Ave
- 1135 Doon Ave
- 504 Lomond Ln
- 80 Cerise Rd
- 522 Lomond Ln
- 528 Lomond Ln
- 534 Lomond Ln