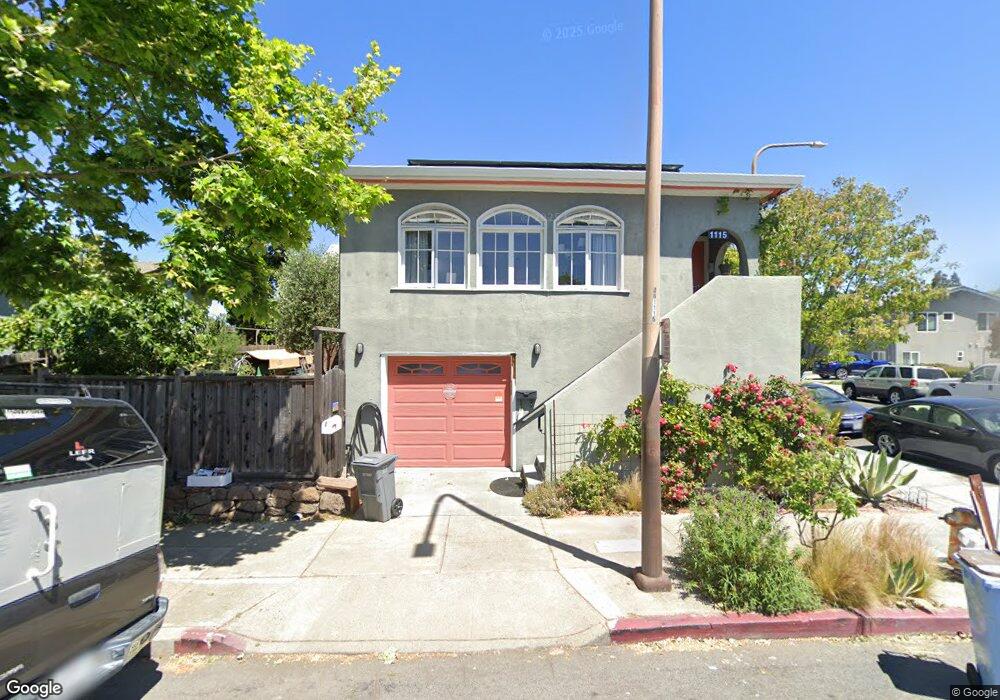
1115 Jones St Berkeley, CA 94702
West Berkeley NeighborhoodEstimated Value: $1,003,000 - $1,442,000
3
Beds
1
Bath
1,210
Sq Ft
$1,029/Sq Ft
Est. Value
About This Home
This home is located at 1115 Jones St, Berkeley, CA 94702 and is currently estimated at $1,245,187, approximately $1,029 per square foot. 1115 Jones St is a home located in Alameda County with nearby schools including Ruth Acty Elementary, Rosa Parks Elementary School, and Berkeley Arts Magnet at Whittier School.
Ownership History
Date
Name
Owned For
Owner Type
Purchase Details
Closed on
Mar 3, 2017
Sold by
Cassidy Neal W and Gogoleva Elena
Bought by
Cassidy Neal W and Gogoleva Elena
Current Estimated Value
Purchase Details
Closed on
Dec 1, 2011
Sold by
Gogoleva Elena and Cassidy Neal W
Bought by
Gogoleva Elena and Cassidy Neal
Home Financials for this Owner
Home Financials are based on the most recent Mortgage that was taken out on this home.
Original Mortgage
$375,800
Outstanding Balance
$257,689
Interest Rate
4.06%
Mortgage Type
New Conventional
Estimated Equity
$987,498
Purchase Details
Closed on
Jun 6, 2009
Sold by
Hau Edmond
Bought by
Gogoleva Elena and Cassidy Neal W
Home Financials for this Owner
Home Financials are based on the most recent Mortgage that was taken out on this home.
Original Mortgage
$388,000
Interest Rate
4.76%
Mortgage Type
Purchase Money Mortgage
Purchase Details
Closed on
Feb 20, 2008
Sold by
Brown Victor H and Estate Of Eileen Louise Howard
Bought by
Hau Edmond
Create a Home Valuation Report for This Property
The Home Valuation Report is an in-depth analysis detailing your home's value as well as a comparison with similar homes in the area
Home Values in the Area
Average Home Value in this Area
Purchase History
| Date | Buyer | Sale Price | Title Company |
|---|---|---|---|
| Cassidy Neal W | -- | None Available | |
| Gogoleva Elena | -- | Old Republic Title Company | |
| Gogoleva Elena | $310,000 | Old Republic Title Co Montcl | |
| Hau Edmond | $282,000 | Old Republic Title Company |
Source: Public Records
Mortgage History
| Date | Status | Borrower | Loan Amount |
|---|---|---|---|
| Open | Gogoleva Elena | $375,800 | |
| Closed | Gogoleva Elena | $388,000 |
Source: Public Records
Tax History
| Year | Tax Paid | Tax Assessment Tax Assessment Total Assessment is a certain percentage of the fair market value that is determined by local assessors to be the total taxable value of land and additions on the property. | Land | Improvement |
|---|---|---|---|---|
| 2025 | $8,269 | $443,421 | $119,753 | $330,668 |
| 2024 | $8,269 | $434,591 | $117,405 | $324,186 |
| 2023 | $8,081 | $432,935 | $115,104 | $317,831 |
| 2022 | $7,900 | $417,449 | $112,848 | $311,601 |
| 2021 | $7,894 | $409,127 | $110,635 | $305,492 |
| 2020 | $7,384 | $411,862 | $109,501 | $302,361 |
| 2019 | $6,998 | $403,789 | $107,355 | $296,434 |
| 2018 | $6,859 | $395,873 | $105,250 | $290,623 |
| 2017 | $6,607 | $388,112 | $103,187 | $284,925 |
| 2016 | $6,329 | $380,504 | $101,164 | $279,340 |
| 2015 | $6,235 | $374,791 | $99,645 | $275,146 |
| 2014 | $6,166 | $367,452 | $97,694 | $269,758 |
Source: Public Records
Map
Nearby Homes
- 1447 Kains Ave
- 1609 Kains Ave
- 1504 10th St
- 1450 Curtis St
- 1400 Santa fe Ave
- 921 Jones St
- 998 Virginia St
- 1207 Francisco St
- 1207 Francisco St Unit 2
- 1728 Curtis St
- 1213 San Pablo Ave
- 1128 Delaware St
- 817 Jones St
- 1322 Virginia St
- 1207 Cornell Ave
- 940 Delaware St
- 1261 Hearst Ave
- 1450 Fourth St Unit 5
- 1919 Curtis St
- 817 Delaware St
- 1460 Kains Ave
- 1111 Jones St
- 1456 Kains Ave
- 1120 Jones St
- 1491 San Pablo Ave
- 1119 Jones St
- 1452 Kains Ave
- 1459 Kains Ave
- 1501 San Pablo Ave
- 1501 Kains Ave
- 1506 Kains Ave
- 1455 Kains Ave
- 1450 Kains Ave
- 1505 Kains Ave
- 1451 Kains Ave
- 1468 Stannage Ave
- 1462 Stannage Ave
- 1512 Kains Ave
- 1444 Kains Ave
- 1507 San Pablo Ave
Your Personal Tour Guide
Ask me questions while you tour the home.