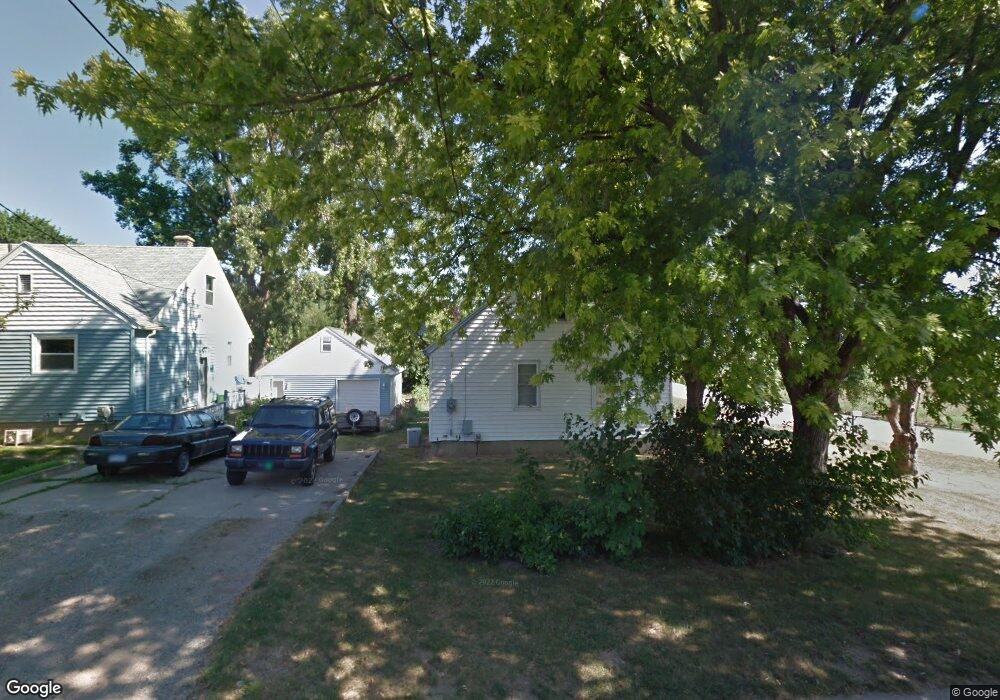
1115 Shirley St Lansing, MI 48911
Southern Lansing NeighborhoodEstimated Value: $107,797 - $150,000
--
Bed
--
Bath
950
Sq Ft
$144/Sq Ft
Est. Value
About This Home
This home is located at 1115 Shirley St, Lansing, MI 48911 and is currently estimated at $136,449, approximately $143 per square foot. 1115 Shirley St is a home located in Ingham County with nearby schools including Kendon School, Attwood School, and Everett High School.
Ownership History
Date
Name
Owned For
Owner Type
Purchase Details
Closed on
Aug 30, 2002
Sold by
Suckow Roy L and Suckow John R
Bought by
Hissong Bonnie
Current Estimated Value
Home Financials for this Owner
Home Financials are based on the most recent Mortgage that was taken out on this home.
Original Mortgage
$81,000
Outstanding Balance
$34,231
Interest Rate
6.4%
Mortgage Type
Purchase Money Mortgage
Estimated Equity
$102,218
Create a Home Valuation Report for This Property
The Home Valuation Report is an in-depth analysis detailing your home's value as well as a comparison with similar homes in the area
Home Values in the Area
Average Home Value in this Area
Purchase History
| Date | Buyer | Sale Price | Title Company |
|---|---|---|---|
| Hissong Bonnie | $81,000 | Midstate Title Company |
Source: Public Records
Mortgage History
| Date | Status | Borrower | Loan Amount |
|---|---|---|---|
| Open | Hissong Bonnie | $81,000 |
Source: Public Records
Tax History Compared to Growth
Tax History
| Year | Tax Paid | Tax Assessment Tax Assessment Total Assessment is a certain percentage of the fair market value that is determined by local assessors to be the total taxable value of land and additions on the property. | Land | Improvement |
|---|---|---|---|---|
| 2025 | $2,228 | $57,200 | $11,200 | $46,000 |
| 2024 | $17 | $47,500 | $11,200 | $36,300 |
| 2023 | $2,090 | $43,700 | $11,200 | $32,500 |
| 2022 | $1,971 | $37,800 | $10,500 | $27,300 |
| 2021 | $2,002 | $33,800 | $7,200 | $26,600 |
| 2020 | $2,006 | $32,300 | $7,200 | $25,100 |
| 2019 | $1,962 | $31,000 | $7,200 | $23,800 |
| 2018 | $1,868 | $27,800 | $7,200 | $20,600 |
| 2017 | $1,813 | $27,800 | $7,200 | $20,600 |
| 2016 | $1,788 | $27,400 | $7,200 | $20,200 |
| 2015 | $1,788 | $26,600 | $14,355 | $12,245 |
| 2014 | $1,788 | $25,600 | $17,944 | $7,656 |
Source: Public Records
Map
Nearby Homes
- 4719 S Pennsylvania Ave
- 5751 Joshua St
- 5808 Orchard Ct
- 5620 Kaynorth Rd
- 0 N Aurelius Rd
- 2018 Worden St
- 629 Emily Ave
- 208 E Northrup St
- 600 E Cavanaugh Rd
- 6115 Lerner Way
- 736 Fenton St
- 709 Jessop Ave
- 6223 Beechfield Dr Unit 8
- 522 E Cavanaugh Rd
- 6238 Beechfield Dr Unit 116
- 6232 Beechfield Dr Unit 113
- 201 E Syringa Dr
- 601 Jessop Ave
- 220 E Potter Ave
- 6300 Beechfield Dr Unit 87
- 1109 Shirley St
- 1103 Shirley St
- 5308 Devonshire Ave
- 1033 Shirley St
- 1102 Willemma St
- 1116 Shirley St
- 1108 Shirley St
- 1102 Shirley St
- 1027 Shirley St
- 1032 Willemma St
- 1026 Willemma St
- 5349 Ellas Ct
- 1023 Shirley St
- 5340 Ellas Ct
- 5355 Ellas Ct
- 1018 Willemma St
- 1115 Willemma St
- 1109 Willemma St
- 1103 Willemma St
- 5350 Ellas Ct