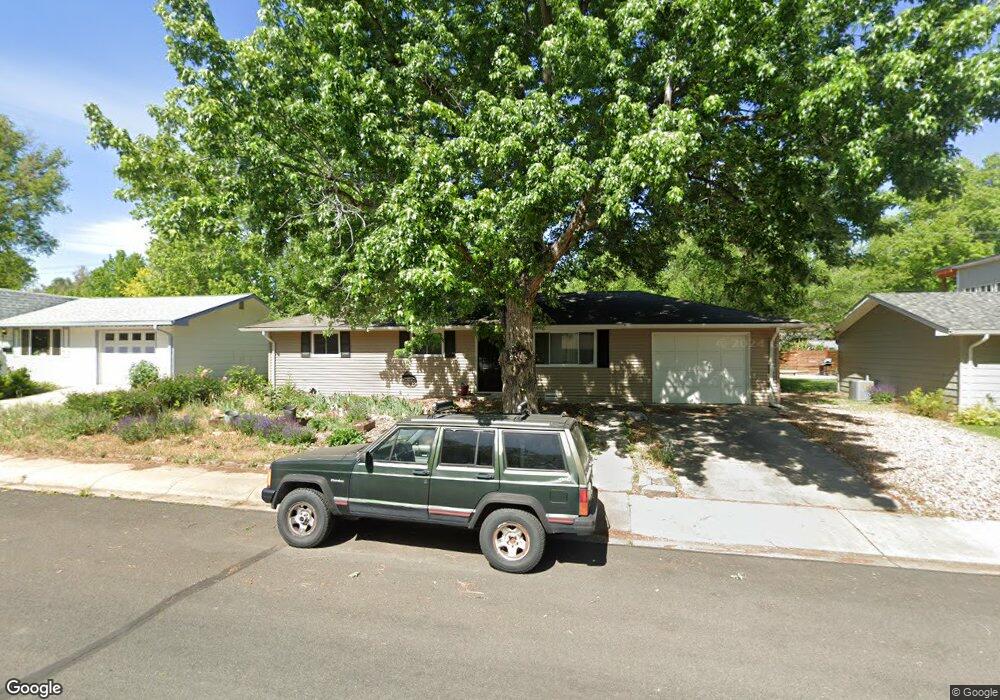
1115 Sumac St Longmont, CO 80501
Loomiller NeighborhoodEstimated Value: $488,000 - $570,000
4
Beds
2
Baths
1,788
Sq Ft
$295/Sq Ft
Est. Value
About This Home
This home is located at 1115 Sumac St, Longmont, CO 80501 and is currently estimated at $528,072, approximately $295 per square foot. 1115 Sumac St is a home located in Boulder County with nearby schools including Mountain View Elementary School, Longs Peak Middle School, and Longmont High School.
Ownership History
Date
Name
Owned For
Owner Type
Purchase Details
Closed on
Jul 22, 2009
Sold by
Shor Lester and Carpenter Rene
Bought by
Bowler Robbin M
Current Estimated Value
Home Financials for this Owner
Home Financials are based on the most recent Mortgage that was taken out on this home.
Original Mortgage
$170,000
Outstanding Balance
$113,186
Interest Rate
5.71%
Mortgage Type
Purchase Money Mortgage
Estimated Equity
$414,886
Purchase Details
Closed on
Aug 30, 2006
Sold by
Kerrigan Melanie Ann
Bought by
Shor Lester
Purchase Details
Closed on
Jun 22, 2006
Sold by
Cinea Victoria Lee
Bought by
Kerrigan Melanie Ann
Purchase Details
Closed on
May 19, 1993
Bought by
Bowler Robbin M
Purchase Details
Closed on
Dec 13, 1971
Bought by
Bowler Robbin M
Create a Home Valuation Report for This Property
The Home Valuation Report is an in-depth analysis detailing your home's value as well as a comparison with similar homes in the area
Home Values in the Area
Average Home Value in this Area
Purchase History
| Date | Buyer | Sale Price | Title Company |
|---|---|---|---|
| Bowler Robbin M | $180,000 | None Available | |
| Shor Lester | $190,000 | Fahtco | |
| Kerrigan Melanie Ann | -- | None Available | |
| Bowler Robbin M | -- | -- | |
| Bowler Robbin M | $21,900 | -- |
Source: Public Records
Mortgage History
| Date | Status | Borrower | Loan Amount |
|---|---|---|---|
| Open | Bowler Robbin M | $170,000 |
Source: Public Records
Tax History Compared to Growth
Tax History
| Year | Tax Paid | Tax Assessment Tax Assessment Total Assessment is a certain percentage of the fair market value that is determined by local assessors to be the total taxable value of land and additions on the property. | Land | Improvement |
|---|---|---|---|---|
| 2025 | $2,961 | $31,463 | $5,688 | $25,775 |
| 2024 | $2,961 | $31,463 | $5,688 | $25,775 |
| 2023 | $2,921 | $30,954 | $6,338 | $28,301 |
| 2022 | $2,620 | $26,472 | $4,663 | $21,809 |
| 2021 | $2,654 | $27,235 | $4,798 | $22,437 |
| 2020 | $2,311 | $23,789 | $4,791 | $18,998 |
| 2019 | $2,274 | $23,789 | $4,791 | $18,998 |
| 2018 | $2,026 | $21,326 | $4,320 | $17,006 |
| 2017 | $1,998 | $23,578 | $4,776 | $18,802 |
| 2016 | $1,713 | $17,918 | $5,094 | $12,824 |
| 2015 | $1,632 | $16,557 | $5,254 | $11,303 |
| 2014 | $1,546 | $16,557 | $5,254 | $11,303 |
Source: Public Records
Map
Nearby Homes