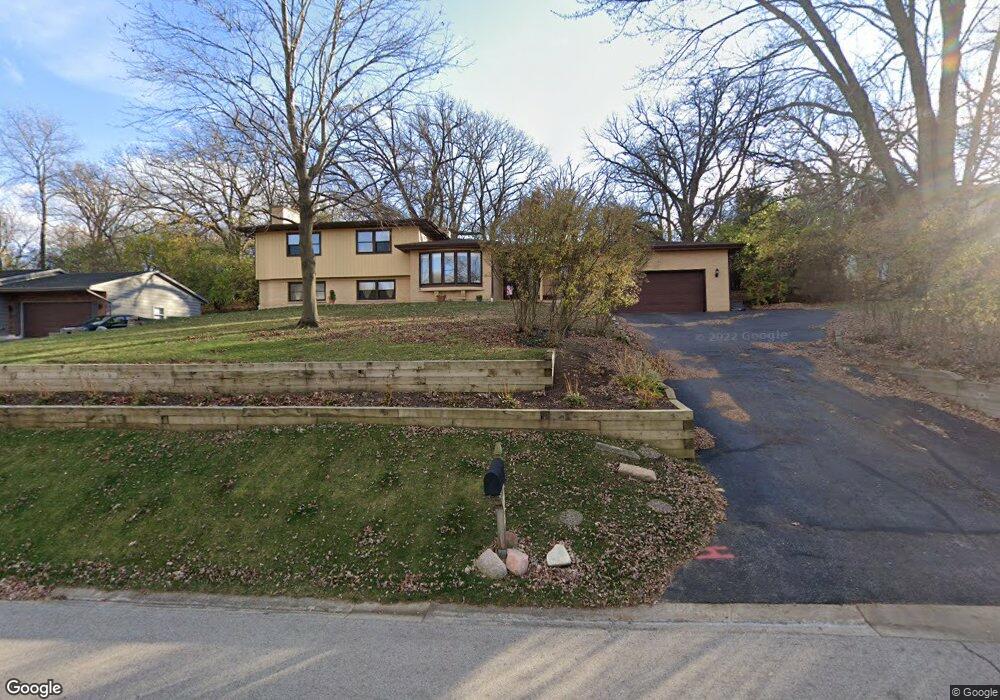
1115 Surrey Ln Algonquin, IL 60102
Estimated Value: $424,000 - $488,000
3
Beds
3
Baths
2,685
Sq Ft
$171/Sq Ft
Est. Value
About This Home
This home is located at 1115 Surrey Ln, Algonquin, IL 60102 and is currently estimated at $459,933, approximately $171 per square foot. 1115 Surrey Ln is a home located in McHenry County with nearby schools including Westfield Community School, Kenneth E Neubert Elementary School, and United Junior High School.
Ownership History
Date
Name
Owned For
Owner Type
Purchase Details
Closed on
Jun 30, 2010
Sold by
Freudenberger Joseph K and Freudenberger Laura A
Bought by
Vician Thomas
Current Estimated Value
Home Financials for this Owner
Home Financials are based on the most recent Mortgage that was taken out on this home.
Original Mortgage
$214,116
Outstanding Balance
$142,496
Interest Rate
4.75%
Mortgage Type
FHA
Estimated Equity
$317,437
Purchase Details
Closed on
Sep 22, 2004
Sold by
Freudenberger Joseph K and Conzemius Laura A
Bought by
Freudenberger Joseph K and Freudenberger Laura A
Purchase Details
Closed on
May 23, 2003
Sold by
Paeth John R and Paeth Dolores M
Bought by
Freudenberger Joseph K and Conzemius Laura A
Home Financials for this Owner
Home Financials are based on the most recent Mortgage that was taken out on this home.
Original Mortgage
$216,000
Interest Rate
5.95%
Mortgage Type
Unknown
Purchase Details
Closed on
Mar 7, 2000
Sold by
Paeth John R and Paeth Dolores M
Bought by
Paeth John R and Paeth Dolores M
Create a Home Valuation Report for This Property
The Home Valuation Report is an in-depth analysis detailing your home's value as well as a comparison with similar homes in the area
Home Values in the Area
Average Home Value in this Area
Purchase History
| Date | Buyer | Sale Price | Title Company |
|---|---|---|---|
| Vician Thomas | $217,000 | First United Title Svcs Inc | |
| Freudenberger Joseph K | -- | -- | |
| Freudenberger Joseph K | $270,000 | Universal Title Services Inc | |
| Paeth John R | -- | -- |
Source: Public Records
Mortgage History
| Date | Status | Borrower | Loan Amount |
|---|---|---|---|
| Open | Vician Thomas | $214,116 | |
| Previous Owner | Freudenberger Joseph K | $216,000 | |
| Closed | Freudenberger Joseph K | $27,000 |
Source: Public Records
Tax History Compared to Growth
Tax History
| Year | Tax Paid | Tax Assessment Tax Assessment Total Assessment is a certain percentage of the fair market value that is determined by local assessors to be the total taxable value of land and additions on the property. | Land | Improvement |
|---|---|---|---|---|
| 2024 | $10,308 | $131,773 | $13,244 | $118,529 |
| 2023 | $9,866 | $117,854 | $11,845 | $106,009 |
| 2022 | $8,541 | $99,598 | $33,485 | $66,113 |
| 2021 | $8,233 | $92,787 | $31,195 | $61,592 |
| 2020 | $8,037 | $89,503 | $30,091 | $59,412 |
| 2019 | $7,866 | $85,665 | $28,801 | $56,864 |
| 2018 | $7,703 | $86,819 | $26,606 | $60,213 |
| 2017 | $7,547 | $81,789 | $25,065 | $56,724 |
| 2016 | $7,436 | $76,711 | $23,509 | $53,202 |
| 2013 | -- | $58,925 | $21,930 | $36,995 |
Source: Public Records
Map
Nearby Homes
- 1 N Hubbard St
- SWC Talaga and Algonquin Rd
- 710 Braewood Dr
- 615 Harper Dr
- 710 Sprucetree Ln
- 1235 Fairmont Ct
- 700 Fairfield Ln
- 1820 Crofton Dr
- 721 Brentwood Ct
- 102 Center St
- 741 Regal Ln
- 661 Majestic Dr
- 1971 Peach Tree Ln
- 266 Grandview Ct
- 2043 Peach Tree Ln Unit 4122
- 2161 Burnham Ct
- 35W240 Crescent Dr
- 1801 Arbordale Ln
- 1245 Winaki Trail
- 1900 Waverly Ln
- 1105 Surrey Ln
- 1125 Surrey Ln
- 1135 Surrey Ln
- 1025 Surrey Ln
- 1205 Surrey Ln
- 1015 Surrey Ln Unit 2
- 5845 Edgewood Dr
- 1215 Surrey Ln
- 1005 Surrey Ln
- 1210 Surrey Ln
- 11720 Devonshire St
- 920 Surrey Ln
- 5705 Edgewood Dr
- 925 N Swamp Bend NE
- 0 Algonquin Road and Hanson Rd Unit MRD11458436
- Lot 12 & Lot 13 Block 15 Lot 13
- 1210 Merrill Ave
- 418 Wildwood Rd
- 000 County Line Ln
- 1225 Surrey Ln