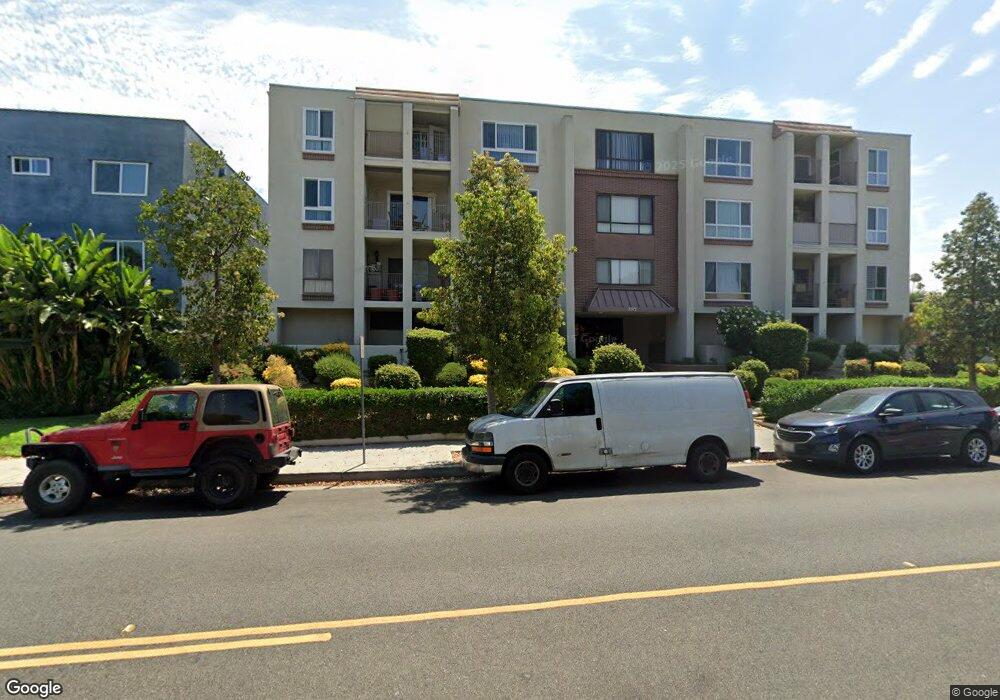
1118 N Central Ave Unit 13 Glendale, CA 91202
Verdugo Viejo NeighborhoodEstimated Value: $689,000 - $793,000
2
Beds
2
Baths
1,184
Sq Ft
$607/Sq Ft
Est. Value
About This Home
This home is located at 1118 N Central Ave Unit 13, Glendale, CA 91202 and is currently estimated at $718,173, approximately $606 per square foot. 1118 N Central Ave Unit 13 is a home located in Los Angeles County with nearby schools including Balboa Elementary School, Eleanor J. Toll Middle School, and Herbert Hoover High School.
Ownership History
Date
Name
Owned For
Owner Type
Purchase Details
Closed on
Oct 17, 2015
Sold by
Gevorkian George
Bought by
Navasardyan Diana and Navasardyan Aida
Current Estimated Value
Home Financials for this Owner
Home Financials are based on the most recent Mortgage that was taken out on this home.
Original Mortgage
$370,600
Outstanding Balance
$289,891
Interest Rate
3.71%
Mortgage Type
New Conventional
Estimated Equity
$428,282
Purchase Details
Closed on
Sep 18, 2008
Sold by
Benson Brenda
Bought by
Gevorkian George
Home Financials for this Owner
Home Financials are based on the most recent Mortgage that was taken out on this home.
Original Mortgage
$240,000
Interest Rate
6.49%
Mortgage Type
Purchase Money Mortgage
Purchase Details
Closed on
Mar 1, 2000
Sold by
Robichaux Irene M
Bought by
The Irene M Robichaux Living Trust
Create a Home Valuation Report for This Property
The Home Valuation Report is an in-depth analysis detailing your home's value as well as a comparison with similar homes in the area
Home Values in the Area
Average Home Value in this Area
Purchase History
| Date | Buyer | Sale Price | Title Company |
|---|---|---|---|
| Navasardyan Diana | $436,000 | Ticor Title Company Of Ca | |
| Gevorkian George | $320,000 | Southland Title Co | |
| The Irene M Robichaux Living Trust | -- | -- |
Source: Public Records
Mortgage History
| Date | Status | Borrower | Loan Amount |
|---|---|---|---|
| Open | Navasardyan Diana | $370,600 | |
| Previous Owner | Gevorkian George | $240,000 |
Source: Public Records
Tax History
| Year | Tax Paid | Tax Assessment Tax Assessment Total Assessment is a certain percentage of the fair market value that is determined by local assessors to be the total taxable value of land and additions on the property. | Land | Improvement |
|---|---|---|---|---|
| 2025 | $5,554 | $516,128 | $332,881 | $183,247 |
| 2024 | $5,554 | $506,008 | $326,354 | $179,654 |
| 2023 | $5,427 | $496,087 | $319,955 | $176,132 |
| 2022 | $5,328 | $486,361 | $313,682 | $172,679 |
| 2021 | $5,234 | $476,826 | $307,532 | $169,294 |
| 2019 | $5,030 | $462,685 | $298,411 | $164,274 |
| 2018 | $4,957 | $453,613 | $292,560 | $161,053 |
| 2016 | $4,724 | $436,000 | $281,200 | $154,800 |
| 2015 | $3,771 | $342,868 | $194,899 | $147,969 |
| 2014 | $3,741 | $336,153 | $191,082 | $145,071 |
Source: Public Records
Map
Nearby Homes
- 1126 N Central Ave Unit 105
- 1126 N Central Ave Unit 101
- 250 W Fairview Ave Unit 301
- 303 W Loraine St Unit 2
- 320 E Stocker St Unit 208
- 1130 Campbell St Unit 106
- 1313 Valley View Rd Unit 213
- 111 W Mountain St Unit 2
- 1151 N Columbus Ave
- 1236 N Columbus Ave Unit 16
- 404 E Randolph St
- 1207 N Columbus Ave
- 222 Monterey Rd Unit 104
- 222 Monterey Rd Unit 1205
- 222 Monterey Rd Unit 206
- 222 Monterey Rd Unit 1302
- 222 Monterey Rd Unit 1603
- 1230 Dorothy Dr
- 350 Burchett St Unit 101
- 1339 N Columbus Ave Unit 304
- 1118 N Central Ave Unit 24
- 1118 N Central Ave Unit 21
- 1118 N Central Ave Unit 23
- 1118 N Central Ave
- 1118 N Central Ave
- 1118 N Central Ave Unit 1
- 1118 N Central Ave
- 1118 N Central Ave Unit 15
- 1118 N Central Ave Unit 12
- 1118 N Central Ave Unit 11
- 1118 N Central Ave Unit 10
- 1118 N Central Ave Unit 9
- 1118 N Central Ave Unit 8
- 1118 N Central Ave Unit 7
- 1118 N Central Ave Unit 6
- 1118 N Central Ave Unit 5
- 1118 N Central Ave Unit 4
- 1118 N Central Ave Unit 3
- 1118 N Central Ave Unit 2
- 1118 N Central Ave Unit 1
Your Personal Tour Guide
Ask me questions while you tour the home.