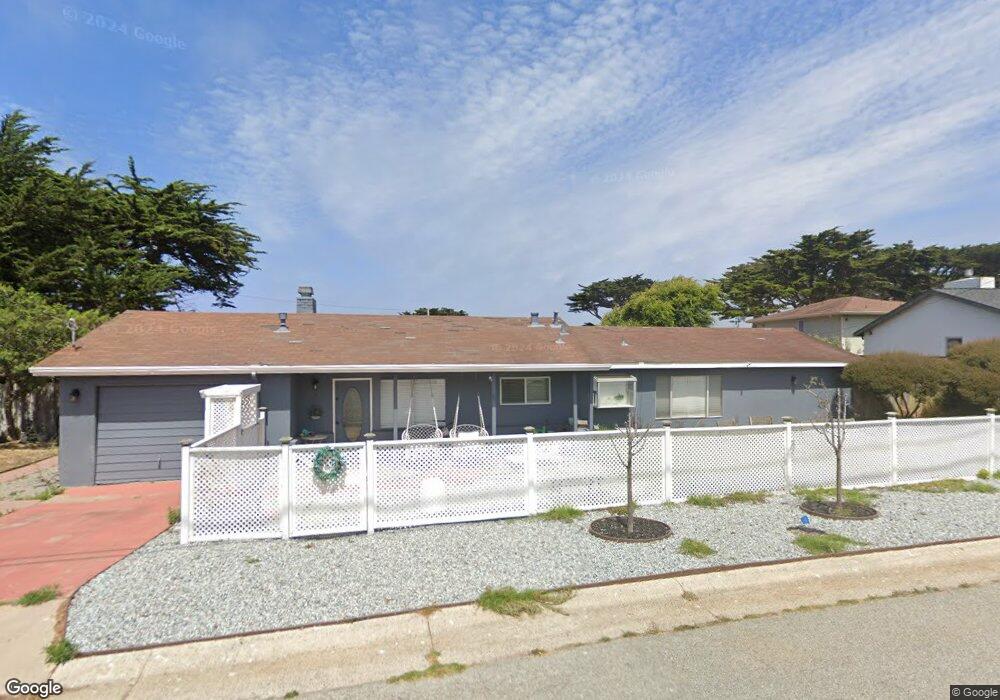
1118 Shell Ave Pacific Grove, CA 93950
Estimated Value: $1,421,727 - $1,701,000
2
Beds
1
Bath
1,102
Sq Ft
$1,424/Sq Ft
Est. Value
About This Home
This home is located at 1118 Shell Ave, Pacific Grove, CA 93950 and is currently estimated at $1,569,432, approximately $1,424 per square foot. 1118 Shell Ave is a home located in Monterey County with nearby schools including Robert Down Elementary School, Pacific Grove Middle School, and Pacific Grove High School.
Ownership History
Date
Name
Owned For
Owner Type
Purchase Details
Closed on
Sep 7, 2022
Sold by
Grillo Weinbrenner Phyllis Renee
Bought by
Phyllis Grillo Weinbrenner Living Trust
Current Estimated Value
Purchase Details
Closed on
Jul 1, 2022
Sold by
Grillo Weinbrenner Phyllis
Bought by
Weinbrenner Phyllis Grillo
Home Financials for this Owner
Home Financials are based on the most recent Mortgage that was taken out on this home.
Original Mortgage
$430,000
Interest Rate
5.09%
Mortgage Type
New Conventional
Purchase Details
Closed on
Jun 2, 2022
Sold by
Geraldine Sue Grillo 1999 Trust
Bought by
Weinbrenner Phyllis Renee Grillo
Home Financials for this Owner
Home Financials are based on the most recent Mortgage that was taken out on this home.
Original Mortgage
$430,000
Interest Rate
5.09%
Mortgage Type
New Conventional
Purchase Details
Closed on
Dec 22, 1999
Sold by
Grillo Geraldine Sue
Bought by
Grillo Geraldine Sue and Geraldine Sue Grillo 1999 Trust
Create a Home Valuation Report for This Property
The Home Valuation Report is an in-depth analysis detailing your home's value as well as a comparison with similar homes in the area
Home Values in the Area
Average Home Value in this Area
Purchase History
| Date | Buyer | Sale Price | Title Company |
|---|---|---|---|
| Phyllis Grillo Weinbrenner Living Trust | -- | -- | |
| Weinbrenner Phyllis Grillo | -- | Lawyers Title | |
| Weinbrenner Phyllis Renee Grillo | -- | Noland Hamerly Etienne & Hoss | |
| Grillo Geraldine Sue | -- | -- |
Source: Public Records
Mortgage History
| Date | Status | Borrower | Loan Amount |
|---|---|---|---|
| Previous Owner | Weinbrenner Phyllis Grillo | $430,000 |
Source: Public Records
Tax History Compared to Growth
Tax History
| Year | Tax Paid | Tax Assessment Tax Assessment Total Assessment is a certain percentage of the fair market value that is determined by local assessors to be the total taxable value of land and additions on the property. | Land | Improvement |
|---|---|---|---|---|
| 2025 | $790 | $71,884 | $33,939 | $37,945 |
| 2024 | $790 | $70,475 | $33,274 | $37,201 |
| 2023 | $834 | $69,094 | $32,622 | $36,472 |
| 2022 | $818 | $67,740 | $31,983 | $35,757 |
| 2021 | $814 | $66,412 | $31,356 | $35,056 |
| 2020 | $798 | $65,732 | $31,035 | $34,697 |
| 2019 | $775 | $64,444 | $30,427 | $34,017 |
| 2018 | $762 | $63,181 | $29,831 | $33,350 |
| 2017 | $750 | $61,944 | $29,247 | $32,697 |
| 2016 | $751 | $60,730 | $28,674 | $32,056 |
| 2015 | $740 | $59,819 | $28,244 | $31,575 |
| 2014 | $725 | $58,648 | $27,691 | $30,957 |
Source: Public Records
Map
Nearby Homes
- 25 Coral St
- 1051 Ocean View Blvd
- 910 Egan Ave
- 221 Pine Garden Ln
- 813 Ocean View Blvd
- 775 Mermaid Ave
- 851 Bayview Ave
- 810 Lighthouse Ave Unit 101
- 304 Grove Acre Ave
- 735 Bayview Ave
- 700 Briggs Ave Unit 103
- 222 Wood St
- 206 Cypress Ave Unit B
- 585 Ocean View Blvd Unit 3
- 311 Walnut St
- 127 16th St
- 132 Forest Ave
- 311 Lobos Ave
- 543 Asilomar Blvd
- 302 Park St