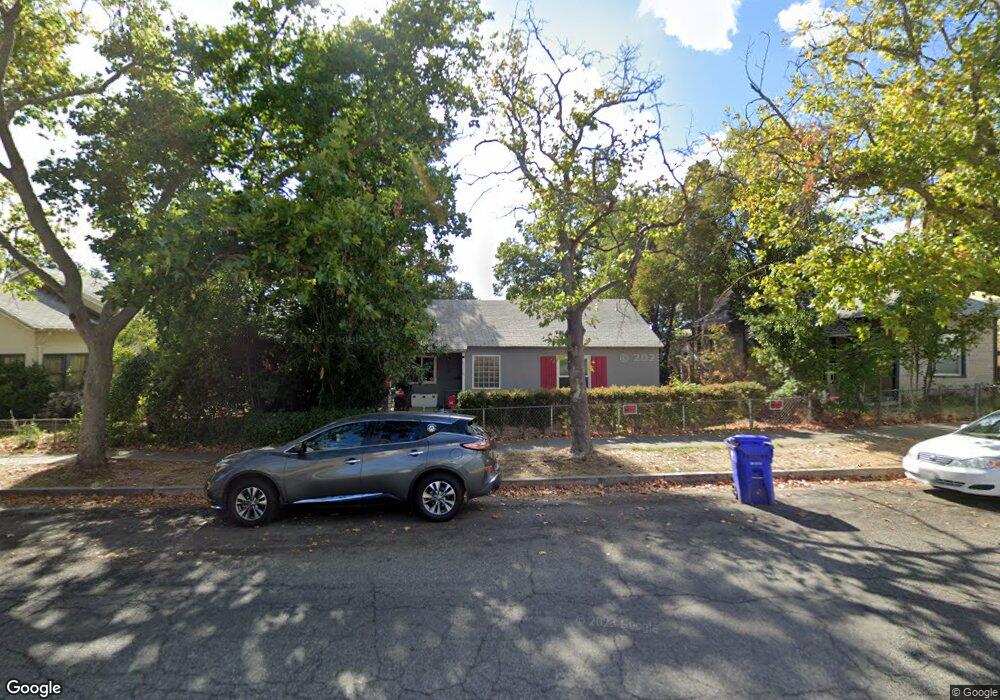
1119 Franklin St Red Bluff, CA 96080
Estimated Value: $215,000 - $270,000
3
Beds
2
Baths
1,426
Sq Ft
$170/Sq Ft
Est. Value
About This Home
This home is located at 1119 Franklin St, Red Bluff, CA 96080 and is currently estimated at $242,686, approximately $170 per square foot. 1119 Franklin St is a home located in Tehama County with nearby schools including Bidwell Elementary School, Vista Preparatory Academy, and Red Bluff High School.
Ownership History
Date
Name
Owned For
Owner Type
Purchase Details
Closed on
Jun 28, 2021
Sold by
Blackketter Michael A and Blackketter Janet L
Bought by
Blackketter Michael A and Blackketter Janet L
Current Estimated Value
Purchase Details
Closed on
Oct 18, 2010
Sold by
Federal Home Loan Mortgage Corporation
Bought by
Blackketter Janet L and Blackketter Michael A
Home Financials for this Owner
Home Financials are based on the most recent Mortgage that was taken out on this home.
Original Mortgage
$58,320
Outstanding Balance
$38,446
Interest Rate
4.33%
Mortgage Type
New Conventional
Estimated Equity
$204,240
Purchase Details
Closed on
Jul 21, 2010
Sold by
Hassel Robert S and Hassel Geri L
Bought by
Federal Home Loan Mortgage Corporation
Create a Home Valuation Report for This Property
The Home Valuation Report is an in-depth analysis detailing your home's value as well as a comparison with similar homes in the area
Home Values in the Area
Average Home Value in this Area
Purchase History
| Date | Buyer | Sale Price | Title Company |
|---|---|---|---|
| Blackketter Michael A | -- | None Available | |
| Blackketter Janet L | $73,000 | Placer Title Company | |
| Federal Home Loan Mortgage Corporation | $76,950 | Accommodation |
Source: Public Records
Mortgage History
| Date | Status | Borrower | Loan Amount |
|---|---|---|---|
| Open | Blackketter Janet L | $58,320 |
Source: Public Records
Tax History Compared to Growth
Tax History
| Year | Tax Paid | Tax Assessment Tax Assessment Total Assessment is a certain percentage of the fair market value that is determined by local assessors to be the total taxable value of land and additions on the property. | Land | Improvement |
|---|---|---|---|---|
| 2025 | $948 | $92,873 | $38,430 | $54,443 |
| 2023 | $932 | $89,269 | $36,939 | $52,330 |
| 2022 | $926 | $87,519 | $36,215 | $51,304 |
| 2021 | $889 | $85,804 | $35,505 | $50,299 |
| 2020 | $908 | $84,925 | $35,141 | $49,784 |
| 2019 | $913 | $83,260 | $34,452 | $48,808 |
| 2018 | $845 | $81,628 | $33,777 | $47,851 |
| 2017 | $853 | $80,028 | $33,115 | $46,913 |
| 2016 | $796 | $78,460 | $32,466 | $45,994 |
| 2015 | -- | $77,283 | $31,979 | $45,304 |
| 2014 | $773 | $75,770 | $31,353 | $44,417 |
Source: Public Records
Map
Nearby Homes
- 1048 Franklin St
- 1359 2nd St
- 1313 Jackson St
- 1435 Garryana Dr
- 728 Lincoln St
- 1514 Walbridge St
- 1158 Madison St
- 1715 Walbridge St
- 1450 Bulkeley St
- 1800 Walbridge St
- 0 Derby Unit 24724349
- 541 Jefferson St
- 1530 Elva Ave
- 931 Rio St
- 846 Rio St
- 701 Rio St
- 2215 Walbridge St
- 2157 Reta Way
- 2132 Reta Way
- 426 Riverside Way
- 1133 Franklin St
- 1105 Franklin St
- 1124 Union St
- 1139 Franklin St Unit 1139 1/2 Franklin St
- 1139 Franklin St
- 1126 1st St
- 1120 1st St
- 1136 1st St
- 1155 Franklin St
- 1125 Crittenden St
- 1146 1st St
- 1038 Union St
- 1038 Union St Unit 1106 Franklin St.
- 1160 1st St
- 1126 Franklin St
- 1125 Union St
- 1115 Union St
- 1142 Franklin St
- 1145 Union St
- 22375 Crittenden Rd