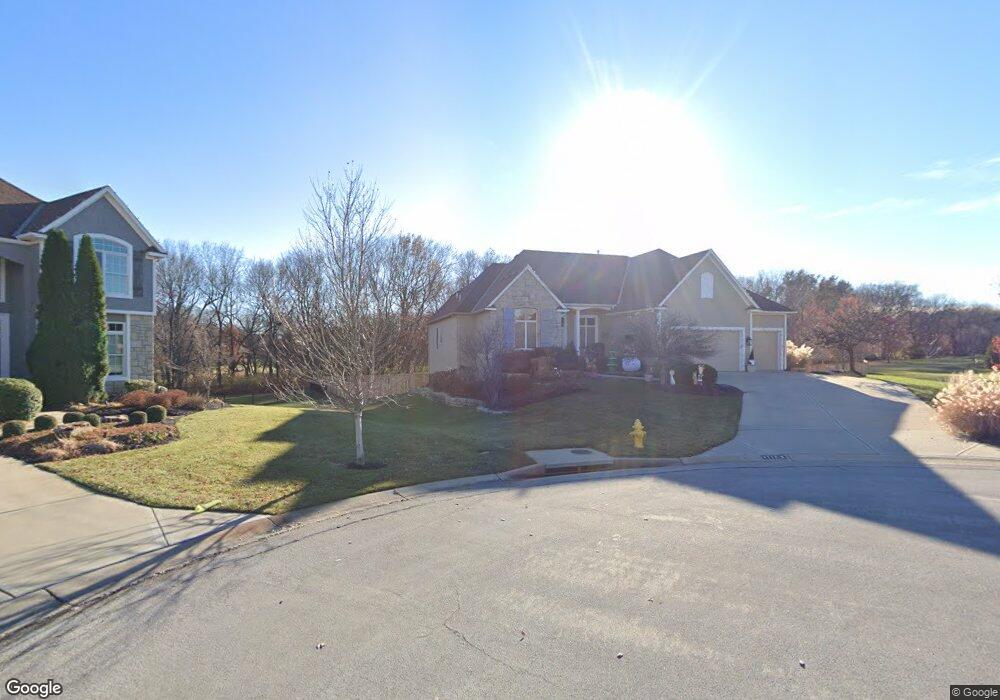
11193 W 146th Terrace Olathe, KS 66062
Estimated Value: $783,000 - $899,124
4
Beds
3
Baths
2,470
Sq Ft
$341/Sq Ft
Est. Value
About This Home
This home is located at 11193 W 146th Terrace, Olathe, KS 66062 and is currently estimated at $842,281, approximately $341 per square foot. 11193 W 146th Terrace is a home located in Johnson County with nearby schools including Morse Elementary School, Aubry Bend Middle School, and Blue Valley Southwest High School.
Ownership History
Date
Name
Owned For
Owner Type
Purchase Details
Closed on
Apr 19, 2012
Sold by
Clark Douglas W and Clark Doris L
Bought by
Clark Doris L and Clark Douglas W
Current Estimated Value
Purchase Details
Closed on
Jul 20, 2011
Sold by
Jim Haas Builders Inc
Bought by
Clark Douglas W and Clark Doris L
Home Financials for this Owner
Home Financials are based on the most recent Mortgage that was taken out on this home.
Original Mortgage
$200,000
Outstanding Balance
$129,451
Interest Rate
3.37%
Mortgage Type
Adjustable Rate Mortgage/ARM
Estimated Equity
$712,830
Purchase Details
Closed on
Jun 7, 2011
Sold by
Kensington Land Development Iii Llc
Bought by
Jim Haas Builders Inc
Home Financials for this Owner
Home Financials are based on the most recent Mortgage that was taken out on this home.
Original Mortgage
$200,000
Outstanding Balance
$129,451
Interest Rate
3.37%
Mortgage Type
Adjustable Rate Mortgage/ARM
Estimated Equity
$712,830
Create a Home Valuation Report for This Property
The Home Valuation Report is an in-depth analysis detailing your home's value as well as a comparison with similar homes in the area
Home Values in the Area
Average Home Value in this Area
Purchase History
| Date | Buyer | Sale Price | Title Company |
|---|---|---|---|
| Clark Doris L | -- | None Available | |
| Clark Douglas W | -- | First American Title | |
| Jim Haas Builders Inc | -- | First American Title |
Source: Public Records
Mortgage History
| Date | Status | Borrower | Loan Amount |
|---|---|---|---|
| Open | Clark Douglas W | $200,000 |
Source: Public Records
Tax History Compared to Growth
Tax History
| Year | Tax Paid | Tax Assessment Tax Assessment Total Assessment is a certain percentage of the fair market value that is determined by local assessors to be the total taxable value of land and additions on the property. | Land | Improvement |
|---|---|---|---|---|
| 2024 | $10,806 | $100,073 | $15,079 | $84,994 |
| 2023 | $9,828 | $90,022 | $15,079 | $74,943 |
| 2022 | $9,345 | $83,502 | $13,692 | $69,810 |
| 2021 | $9,345 | $76,268 | $12,444 | $63,824 |
| 2020 | $8,892 | $74,658 | $12,444 | $62,214 |
| 2019 | $8,655 | $71,231 | $12,978 | $58,253 |
| 2018 | $8,369 | $67,597 | $11,272 | $56,325 |
| 2017 | $8,383 | $66,389 | $11,272 | $55,117 |
| 2016 | $8,101 | $64,239 | $11,272 | $52,967 |
| 2015 | $8,291 | $64,917 | $11,272 | $53,645 |
| 2013 | -- | $59,777 | $13,023 | $46,754 |
Source: Public Records
Map
Nearby Homes
- The Santa Barbara Plan at Polo Fields
- The Laguna Plan at Polo Fields
- The Laguna 1.5 Story Plan at Polo Fields
- Windsor Plan at Chapel Hill
- Bristol Plan at Chapel Hill
- The Breckenridge Plan at Polo Fields
- 11110 W 146th Terrace
- 11130 W 146th Terrace
- 14516 Reeder St
- 11801 W 149th St
- 14622 S Garnett St
- 11308 W 143rd Terrace
- 14308 Barton St
- 11814 W 149th St
- 14388 S Cody St
- 14157 Bond St
- 10675 W 142nd Terrace
- 14124 Flint St
- 10808 W 141st St
- Westminster Plan at Villas of Avalon
- 11197 W 146th Terrace
- 11189 W 146th Terrace
- 11239 W 146th Terrace
- 11185 W 146th Terrace
- 11181 W 146th Terrace
- 11177 W 146th Terrace
- 11263 W 146th Terrace
- 11115 W 146th Terrace
- 11115 W 146th Terrace
- 11208 W 146th Terrace
- 11236 W 146th Terrace
- 11172 W 146th Terrace
- 14750 Bond St
- 11157 W 146th Terrace
- 11264 W 146th Terrace
- 11291 W 146th Terrace
- 11160 W 146th Terrace
- 11111 W 146th Terrace
- 11292 W 146th Terrace
- 11145 W 146th Terrace