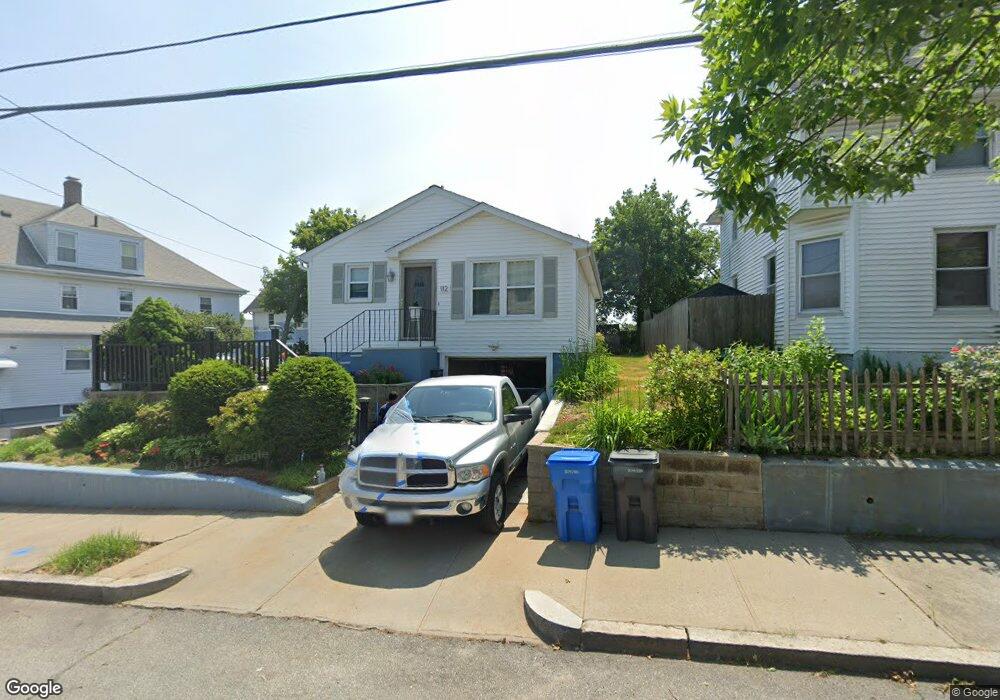
112 Franklin Ave Cranston, RI 02920
Arlington NeighborhoodEstimated Value: $347,000 - $387,000
3
Beds
1
Bath
984
Sq Ft
$373/Sq Ft
Est. Value
About This Home
This home is located at 112 Franklin Ave, Cranston, RI 02920 and is currently estimated at $366,889, approximately $372 per square foot. 112 Franklin Ave is a home located in Providence County with nearby schools including Hugh B. Bain Middle School, Cranston High School East, and Achievement First Iluminar Mayoral Academy.
Ownership History
Date
Name
Owned For
Owner Type
Purchase Details
Closed on
Dec 18, 2013
Sold by
Marroquin Rosa A and Sanceaz Juan C
Bought by
Reyes Rosa A and Sanchez Juan C
Current Estimated Value
Home Financials for this Owner
Home Financials are based on the most recent Mortgage that was taken out on this home.
Original Mortgage
$113,000
Outstanding Balance
$30,756
Interest Rate
4.15%
Estimated Equity
$336,133
Purchase Details
Closed on
Apr 25, 2013
Sold by
Marroquin Gabriel A and Marroquin Rosa A
Bought by
Maroquin Rosa A and Sanchez Juan C
Purchase Details
Closed on
Mar 29, 1995
Sold by
Central Bldg Inc
Bought by
Decastro Manuel P and Decastro Maria
Home Financials for this Owner
Home Financials are based on the most recent Mortgage that was taken out on this home.
Original Mortgage
$73,500
Interest Rate
8.8%
Create a Home Valuation Report for This Property
The Home Valuation Report is an in-depth analysis detailing your home's value as well as a comparison with similar homes in the area
Home Values in the Area
Average Home Value in this Area
Purchase History
| Date | Buyer | Sale Price | Title Company |
|---|---|---|---|
| Reyes Rosa A | -- | -- | |
| Maroquin Rosa A | -- | -- | |
| Decastro Manuel P | $98,500 | -- |
Source: Public Records
Mortgage History
| Date | Status | Borrower | Loan Amount |
|---|---|---|---|
| Open | Reyes Rosa A | $113,000 | |
| Previous Owner | Decastro Manuel P | $135,500 | |
| Previous Owner | Decastro Manuel P | $74,000 | |
| Previous Owner | Decastro Manuel P | $73,500 |
Source: Public Records
Tax History Compared to Growth
Tax History
| Year | Tax Paid | Tax Assessment Tax Assessment Total Assessment is a certain percentage of the fair market value that is determined by local assessors to be the total taxable value of land and additions on the property. | Land | Improvement |
|---|---|---|---|---|
| 2025 | $4,475 | $322,400 | $101,300 | $221,100 |
| 2024 | $4,388 | $322,400 | $101,300 | $221,100 |
| 2023 | $3,769 | $199,400 | $44,500 | $154,900 |
| 2022 | $3,691 | $199,400 | $44,500 | $154,900 |
| 2021 | $3,589 | $199,400 | $44,500 | $154,900 |
| 2020 | $3,311 | $159,400 | $34,900 | $124,500 |
| 2019 | $3,311 | $159,400 | $34,900 | $124,500 |
| 2018 | $3,234 | $159,400 | $34,900 | $124,500 |
| 2017 | $2,663 | $116,100 | $15,900 | $100,200 |
| 2016 | $2,606 | $116,100 | $15,900 | $100,200 |
| 2015 | $2,606 | $116,100 | $15,900 | $100,200 |
| 2014 | $2,542 | $111,300 | $15,900 | $95,400 |
Source: Public Records
Map
Nearby Homes
- 116 Franklin Ave
- 409 Webster Ave
- 415 Webster Ave
- 419 Webster Ave
- 111 Franklin Ave
- 405 Webster Ave
- 122 Franklin Ave
- 117 Franklin Ave
- 77 Whipple Ave Unit 79
- 397 Webster Ave
- 75 Whipple Ave
- 69 Whipple Ave
- 18 Ryder Ave
- 22 Ryder Ave
- 16 Ryder Ave
- 26 Ryder Ave
- 87 Whipple Ave
- 416 Webster Ave
- 12 Ryder Ave
- 65 Whipple Ave Unit 67