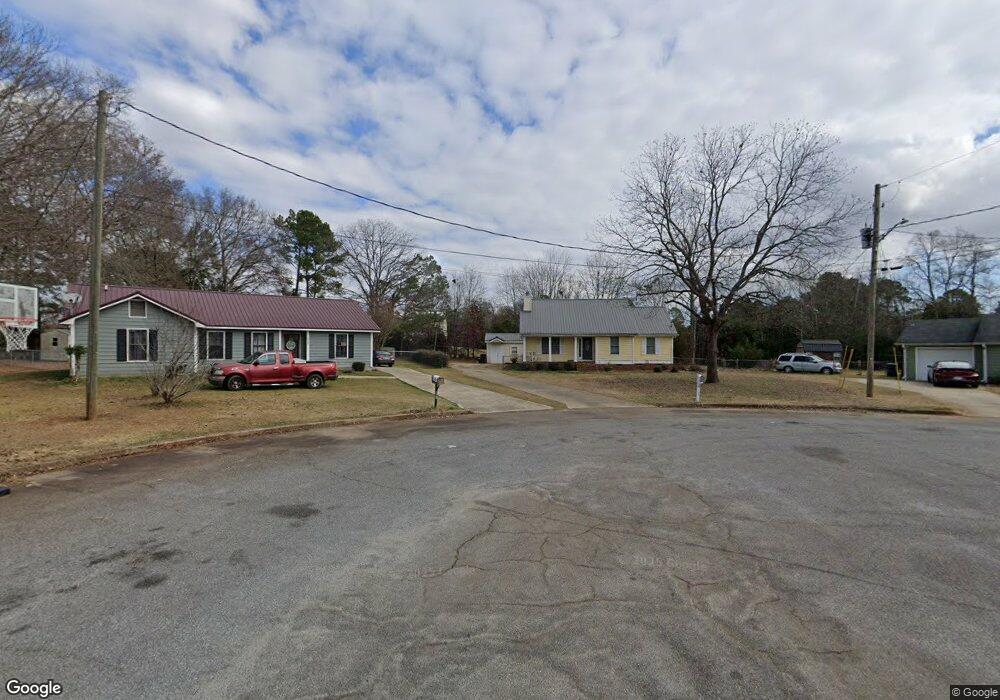
112 Shirley Rd Americus, GA 31709
Estimated Value: $143,993 - $185,000
3
Beds
2
Baths
1,317
Sq Ft
$130/Sq Ft
Est. Value
About This Home
This home is located at 112 Shirley Rd, Americus, GA 31709 and is currently estimated at $170,998, approximately $129 per square foot. 112 Shirley Rd is a home located in Sumter County with nearby schools including Sumter County Primary School, Sumter County Elementary School, and Sumter County Middle School.
Ownership History
Date
Name
Owned For
Owner Type
Purchase Details
Closed on
Jun 5, 2017
Sold by
Newkirk Katheleen J
Bought by
Hebert Michael B and Hebert April K
Current Estimated Value
Home Financials for this Owner
Home Financials are based on the most recent Mortgage that was taken out on this home.
Original Mortgage
$98,188
Outstanding Balance
$81,334
Interest Rate
3.87%
Mortgage Type
FHA
Estimated Equity
$89,664
Purchase Details
Closed on
Mar 7, 2008
Sold by
Newkirk Allan P
Bought by
Newkirk Allen P
Purchase Details
Closed on
Jul 27, 2004
Sold by
Newkirk Allan P
Bought by
Newkirk Allan P
Purchase Details
Closed on
Jun 13, 1997
Sold by
Turner Patrick R
Bought by
Newkirk Allan P
Purchase Details
Closed on
Jan 30, 1997
Sold by
Bailey Bailey and Bailey Randle
Bought by
Turner Patrick R
Purchase Details
Closed on
Aug 29, 1995
Sold by
Ray James D
Bought by
Bailey Bailey and Bailey Randle
Purchase Details
Closed on
Apr 29, 1994
Bought by
Ray James D
Create a Home Valuation Report for This Property
The Home Valuation Report is an in-depth analysis detailing your home's value as well as a comparison with similar homes in the area
Home Values in the Area
Average Home Value in this Area
Purchase History
| Date | Buyer | Sale Price | Title Company |
|---|---|---|---|
| Hebert Michael B | $100,000 | -- | |
| Newkirk Allen P | -- | -- | |
| Newkirk Allan P | -- | -- | |
| Newkirk Allan P | $83,500 | -- | |
| Turner Patrick R | $29,000 | -- | |
| Bailey Bailey | $45,000 | -- | |
| Ray James D | $46,700 | -- |
Source: Public Records
Mortgage History
| Date | Status | Borrower | Loan Amount |
|---|---|---|---|
| Open | Hebert Michael B | $98,188 |
Source: Public Records
Tax History Compared to Growth
Tax History
| Year | Tax Paid | Tax Assessment Tax Assessment Total Assessment is a certain percentage of the fair market value that is determined by local assessors to be the total taxable value of land and additions on the property. | Land | Improvement |
|---|---|---|---|---|
| 2024 | $1,656 | $36,720 | $4,040 | $32,680 |
| 2023 | $1,620 | $36,720 | $4,040 | $32,680 |
| 2022 | $1,110 | $36,720 | $4,040 | $32,680 |
| 2021 | $1,623 | $36,720 | $4,040 | $32,680 |
| 2020 | $1,661 | $36,720 | $4,040 | $32,680 |
| 2019 | $1,757 | $36,720 | $4,040 | $32,680 |
| 2018 | $1,155 | $36,720 | $4,040 | $32,680 |
| 2017 | $920 | $36,720 | $4,040 | $32,680 |
| 2016 | $1,378 | $36,520 | $4,040 | $32,480 |
| 2015 | $1,067 | $42,320 | $4,040 | $38,280 |
| 2014 | $1,066 | $42,320 | $4,040 | $38,280 |
| 2013 | -- | $42,320 | $4,040 | $38,280 |
Source: Public Records
Map
Nearby Homes
- TBD Grande Ave
- 205 Valley Dr
- TBD Valley Dr
- 1202 S Lee St
- 1105 Elm Ave
- 104 Westlake Cir
- 130 W Dodson St
- Lot 5 Lake Jennifer Dr
- 126 Bell St
- 115 Lake Jennifer Dr
- 229 Bell St
- 704 Harrold Ave
- 624 Harrold Ave
- 501 S Lee St
- 518 E Furlow St
- 302 W College St
- 105 Springfield Ave
- 0 Beale St
- 316 Taylor St
- 406 S Hampton St
- 113 Shirley Rd
- 114 Shirley Rd
- 115 Shirley Rd
- 116 Shirley Rd
- 117 Shirley Rd
- 118 Shirley Rd
- 105 Glenwood Rd
- 136 Columbia Ave
- 107 Glenwood Rd
- 119 Shirley Rd
- 120 Shirley Rd
- 103 Glenwood Rd
- 109 Glenwood Rd
- 140 Columbia Ave
- 121 Shirley Rd
- 122 Shirley Rd
- 111 Glenwood Rd
- 142 Columbia Ave
- 101 Glenwood Rd
- 123 Shirley Rd