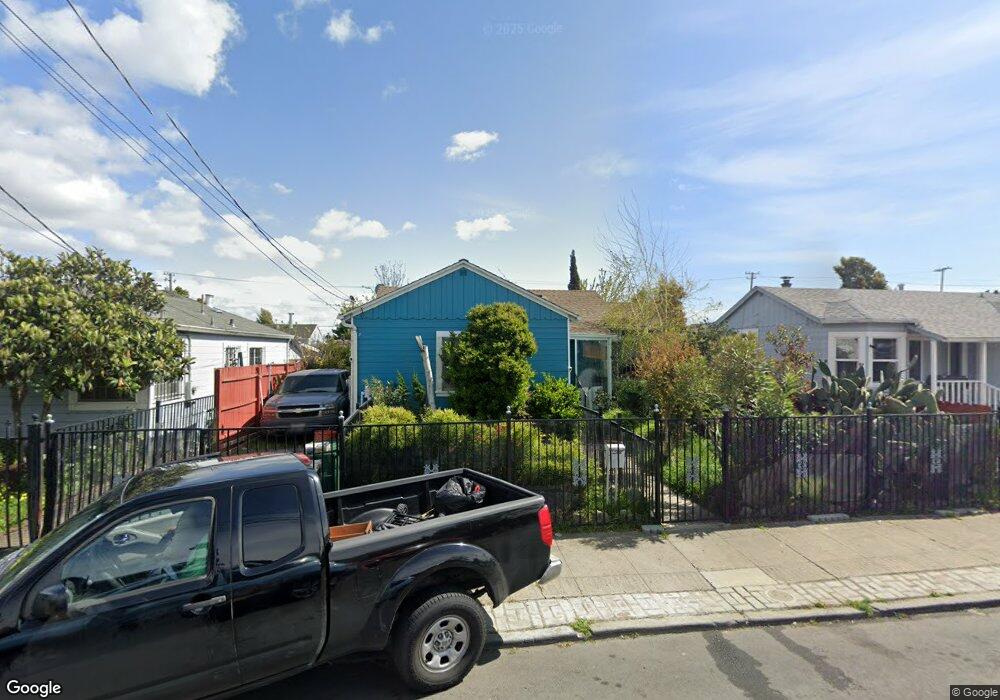
1120 76th Ave Oakland, CA 94621
Fitchburg NeighborhoodEstimated Value: $489,000 - $660,000
3
Beds
2
Baths
1,583
Sq Ft
$352/Sq Ft
Est. Value
About This Home
This home is located at 1120 76th Ave, Oakland, CA 94621 and is currently estimated at $556,645, approximately $351 per square foot. 1120 76th Ave is a home located in Alameda County with nearby schools including Futures & CUES at Lockwood, Greenleaf TK-8, and Coliseum College Prep Academy.
Ownership History
Date
Name
Owned For
Owner Type
Purchase Details
Closed on
Jul 26, 2024
Sold by
Gray Leo R and Gray Barbara J
Bought by
Leo R Gray And Barbara J Gray Revocable Livin and Gray
Current Estimated Value
Purchase Details
Closed on
Aug 17, 2000
Sold by
Gray Michael L
Bought by
Gray Leo R and Gray Barbara J
Home Financials for this Owner
Home Financials are based on the most recent Mortgage that was taken out on this home.
Original Mortgage
$105,500
Interest Rate
8.15%
Purchase Details
Closed on
Oct 31, 1994
Sold by
Sheppard William and Sheppard Beaulah
Bought by
Gray Leo R and Gray Barbara J
Home Financials for this Owner
Home Financials are based on the most recent Mortgage that was taken out on this home.
Original Mortgage
$104,500
Interest Rate
8.78%
Create a Home Valuation Report for This Property
The Home Valuation Report is an in-depth analysis detailing your home's value as well as a comparison with similar homes in the area
Home Values in the Area
Average Home Value in this Area
Purchase History
| Date | Buyer | Sale Price | Title Company |
|---|---|---|---|
| Leo R Gray And Barbara J Gray Revocable Livin | -- | None Listed On Document | |
| Gray Leo R | $35,500 | Landsafe Title | |
| Gray Leo R | $110,000 | Old Republic Title Company |
Source: Public Records
Mortgage History
| Date | Status | Borrower | Loan Amount |
|---|---|---|---|
| Previous Owner | Gray Leo R | $105,500 | |
| Previous Owner | Gray Leo R | $104,500 |
Source: Public Records
Tax History Compared to Growth
Tax History
| Year | Tax Paid | Tax Assessment Tax Assessment Total Assessment is a certain percentage of the fair market value that is determined by local assessors to be the total taxable value of land and additions on the property. | Land | Improvement |
|---|---|---|---|---|
| 2025 | $4,043 | $177,756 | $55,427 | $129,329 |
| 2024 | $4,043 | $174,134 | $54,340 | $126,794 |
| 2023 | $4,138 | $177,583 | $53,275 | $124,308 |
| 2022 | $3,969 | $167,101 | $52,230 | $121,871 |
| 2021 | $3,665 | $163,688 | $51,206 | $119,482 |
| 2020 | $3,622 | $168,938 | $50,681 | $118,257 |
| 2019 | $3,404 | $165,626 | $49,688 | $115,938 |
| 2018 | $3,335 | $162,378 | $48,713 | $113,665 |
| 2017 | $3,177 | $159,195 | $47,758 | $111,437 |
| 2016 | $2,994 | $156,074 | $46,822 | $109,252 |
| 2015 | $2,973 | $153,731 | $46,119 | $107,612 |
| 2014 | $2,912 | $150,720 | $45,216 | $105,504 |
Source: Public Records
Map
Nearby Homes