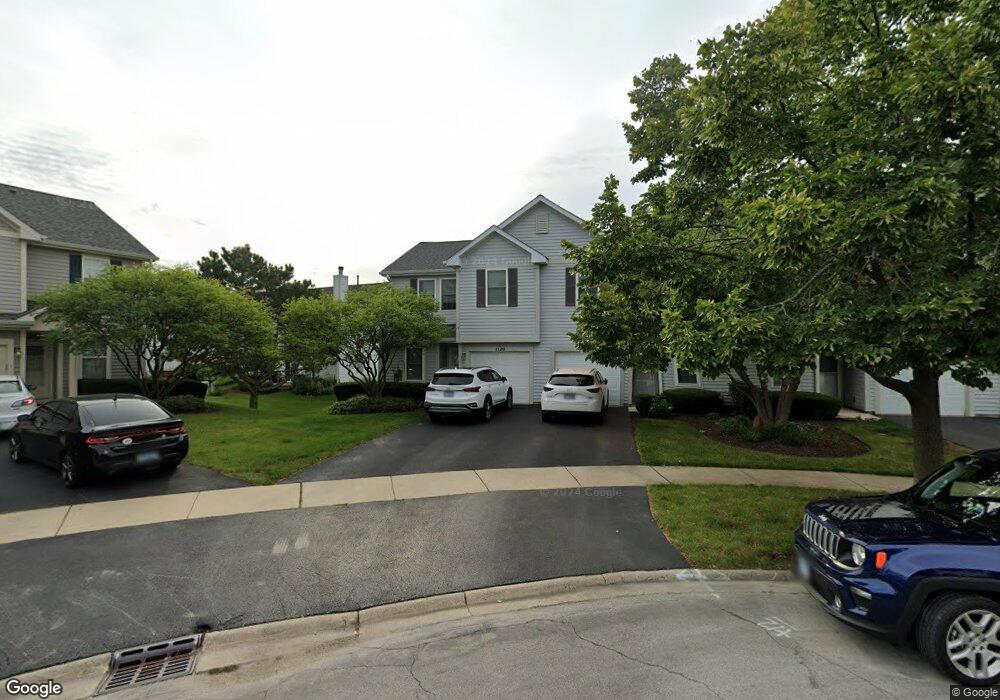
1120 Vail Ct Unit A Naperville, IL 60540
West Wind NeighborhoodEstimated Value: $302,000 - $418,000
2
Beds
3
Baths
1,298
Sq Ft
$266/Sq Ft
Est. Value
About This Home
This home is located at 1120 Vail Ct Unit A, Naperville, IL 60540 and is currently estimated at $344,939, approximately $265 per square foot. 1120 Vail Ct Unit A is a home located in DuPage County with nearby schools including May Watts Elementary School, Thayer J. Hill Middle School, and Metea Valley High School.
Ownership History
Date
Name
Owned For
Owner Type
Purchase Details
Closed on
Jun 3, 2021
Sold by
Zahora Matthew
Bought by
Matthew Zahora Trust and Zahora
Current Estimated Value
Purchase Details
Closed on
Jan 29, 2020
Sold by
Zahora Kevin and Zahora Teresa
Bought by
Zahora Matthew
Home Financials for this Owner
Home Financials are based on the most recent Mortgage that was taken out on this home.
Original Mortgage
$182,750
Interest Rate
4.87%
Mortgage Type
New Conventional
Purchase Details
Closed on
Sep 29, 2007
Sold by
Shannon Neil J
Bought by
Zahora Kevin and Zahora Theresa
Purchase Details
Closed on
Feb 14, 1995
Sold by
Estes Park Ltd Partnership
Bought by
Shannon Neil J
Home Financials for this Owner
Home Financials are based on the most recent Mortgage that was taken out on this home.
Original Mortgage
$87,400
Interest Rate
7.75%
Create a Home Valuation Report for This Property
The Home Valuation Report is an in-depth analysis detailing your home's value as well as a comparison with similar homes in the area
Home Values in the Area
Average Home Value in this Area
Purchase History
| Date | Buyer | Sale Price | Title Company |
|---|---|---|---|
| Matthew Zahora Trust | -- | Cunningham Jeanine | |
| Zahora Matthew | $215,000 | Cti | |
| Zahora Kevin | $200,000 | Ticor Title Insurance Co | |
| Shannon Neil J | $117,500 | -- |
Source: Public Records
Mortgage History
| Date | Status | Borrower | Loan Amount |
|---|---|---|---|
| Previous Owner | Zahora Matthew | $182,750 | |
| Previous Owner | Shannon Neil J | $87,400 |
Source: Public Records
Tax History Compared to Growth
Tax History
| Year | Tax Paid | Tax Assessment Tax Assessment Total Assessment is a certain percentage of the fair market value that is determined by local assessors to be the total taxable value of land and additions on the property. | Land | Improvement |
|---|---|---|---|---|
| 2024 | $4,833 | $85,427 | $28,524 | $56,903 |
| 2023 | $4,597 | $76,760 | $25,630 | $51,130 |
| 2022 | $4,344 | $69,570 | $23,060 | $46,510 |
| 2021 | $4,199 | $67,090 | $22,240 | $44,850 |
| 2020 | $4,193 | $67,090 | $22,240 | $44,850 |
| 2019 | $4,017 | $63,810 | $21,150 | $42,660 |
| 2018 | $3,781 | $59,420 | $19,870 | $39,550 |
| 2017 | $3,669 | $57,410 | $19,200 | $38,210 |
| 2016 | $3,592 | $55,100 | $18,430 | $36,670 |
| 2015 | $3,544 | $52,320 | $17,500 | $34,820 |
| 2014 | $3,497 | $50,120 | $16,640 | $33,480 |
| 2013 | $3,492 | $50,470 | $16,760 | $33,710 |
Source: Public Records
Map
Nearby Homes
- 891 Lowell Ln
- 1262 Rhodes Ln Unit 2701
- 1208 Tennyson Ln
- 1114 Tennyson Ln
- 2459 Emerson Ln
- 1259 Natchez Trace Cir
- 822 Shandrew Dr Unit 103
- 2809 Blakely Ln Unit 24
- 856 Cardiff Rd
- 2783 Blakely Ln Unit 34
- 7S410 Arbor Dr
- 1033 Emerald Dr
- 316 Hemlock Ln
- 134 S Whispering Hills Dr
- 225 Elmwood Dr
- 845 Tulip Ln
- 319 Claremont Ct
- 122 Encina Dr
- 27W264 80th St
- 479 River Bend Rd Unit 111
- 1120 Vail Ct Unit 117
- 1124 Vail Ct
- 1128 Vail Ct Unit 119
- 1116 Vail Ct
- 1132 Vail Ct Unit 120
- 1123 Grand Lake Ct Unit 134
- 1112 Vail Ct Unit 115
- 1127 Grand Lake Ct
- 1119 Grand Lake Ct Unit 135
- 1131 Grand Lake Ct Unit 132
- 1108 Vail Ct Unit 114
- 1135 Grand Lake Ct Unit 131
- 1115 Grand Lake Ct Unit 136
- 1104 Vail Ct
- 1140 Vail Ct
- 1139 Grand Lake Ct
- 1111 Grand Lake Ct Unit 137
- 1107 Grand Lake Ct Unit 138
- 1148 Vail Ct
- 1171 Whispering Hills Dr Unit 125