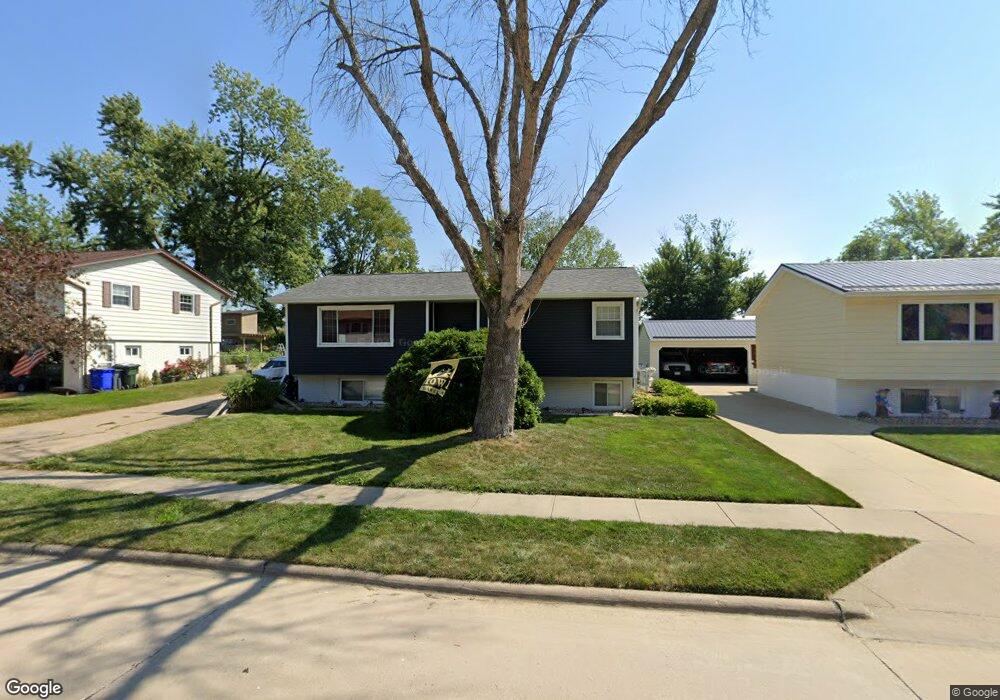
1121 38th St NW Cedar Rapids, IA 52405
Estimated Value: $198,822 - $222,000
3
Beds
2
Baths
948
Sq Ft
$222/Sq Ft
Est. Value
About This Home
This home is located at 1121 38th St NW, Cedar Rapids, IA 52405 and is currently estimated at $210,706, approximately $222 per square foot. 1121 38th St NW is a home located in Linn County with nearby schools including Maple Grove Elementary School, North Middletown Elementary School, and Ponderosa Elementary School.
Ownership History
Date
Name
Owned For
Owner Type
Purchase Details
Closed on
Feb 28, 2006
Sold by
Antolik George A
Bought by
Young Shantry and Young Carol
Current Estimated Value
Home Financials for this Owner
Home Financials are based on the most recent Mortgage that was taken out on this home.
Original Mortgage
$102,000
Outstanding Balance
$61,413
Interest Rate
7.5%
Mortgage Type
Stand Alone First
Estimated Equity
$149,293
Purchase Details
Closed on
Apr 28, 2005
Sold by
Akers Julie Ann and Glessner Harry E
Bought by
Antolik George A
Purchase Details
Closed on
Jun 25, 2001
Sold by
Glessner Martha A and Glessner Harry E
Bought by
Akers Douglas Allen and Akers Julie Ann
Purchase Details
Closed on
Nov 4, 1998
Sold by
Seifried Jerome F and Seifried Mary J
Bought by
Seifried Jerome F and Seifried Mary J
Create a Home Valuation Report for This Property
The Home Valuation Report is an in-depth analysis detailing your home's value as well as a comparison with similar homes in the area
Home Values in the Area
Average Home Value in this Area
Purchase History
| Date | Buyer | Sale Price | Title Company |
|---|---|---|---|
| Young Shantry | $127,000 | None Available | |
| Antolik George A | $89,500 | -- | |
| Akers Douglas Allen | -- | -- | |
| Glessner Harry E | -- | -- | |
| Seifried Jerome F | -- | -- |
Source: Public Records
Mortgage History
| Date | Status | Borrower | Loan Amount |
|---|---|---|---|
| Open | Young Shantry | $102,000 | |
| Closed | Young Shantry | $25,500 |
Source: Public Records
Tax History Compared to Growth
Tax History
| Year | Tax Paid | Tax Assessment Tax Assessment Total Assessment is a certain percentage of the fair market value that is determined by local assessors to be the total taxable value of land and additions on the property. | Land | Improvement |
|---|---|---|---|---|
| 2025 | $3,048 | $185,200 | $42,200 | $143,000 |
| 2024 | $57 | $185,500 | $42,200 | $143,300 |
| 2023 | $57 | $172,200 | $42,200 | $130,000 |
| 2022 | $57 | $148,600 | $32,800 | $115,800 |
| 2021 | $3,158 | $146,600 | $32,800 | $113,800 |
| 2020 | $2,986 | $143,100 | $32,800 | $110,300 |
| 2019 | $2,996 | $139,000 | $29,700 | $109,300 |
| 2018 | $2,914 | $139,000 | $29,700 | $109,300 |
| 2017 | $3,032 | $139,200 | $29,700 | $109,500 |
| 2016 | $2,914 | $137,100 | $29,700 | $107,400 |
| 2015 | $2,892 | $135,920 | $29,718 | $106,202 |
| 2014 | $2,892 | $135,920 | $29,718 | $106,202 |
| 2013 | $2,830 | $135,920 | $29,718 | $106,202 |
Source: Public Records
Map
Nearby Homes
- 3313 Crestwood Dr NW
- 3312 G Ave NW
- 1608 Morris Ave NW
- 327* Edgewood Rd NW
- 1322 Woodside Dr NW
- 3507 E Ave NW Unit F
- 3509 E Ave NW Unit D
- 1410 Adair Ct SW Unit Lot 2
- 3802 Richland Dr NW
- 1613 Southview Dr NW
- 912 29th St NW
- 2825 Schultz Dr NW
- 2801 Schultz Dr NW
- 3600 Midway Dr NW
- 4819 Fruitwood Ln NW
- 327 NW Edgewood Rd Unit 324, 330, 336, 342 C
- 1733 Hillside Dr NW
- 2623 Iris Ave NW
- 1722 Gardner Dr NW
- 623 27th St NW
- 1115 38th St NW
- 1127 38th St NW
- 1203 38th St NW
- 3750 Crestwood Dr NW
- 3756 Crestwood Dr NW
- 3762 Crestwood Dr NW
- 1209 38th St NW
- 1122 38th St NW
- 1128 38th St NW
- 1116 38th St NW
- 3746 Crestwood Dr NW
- 1204 38th St NW
- 3812 Crestwood Dr NW
- 1215 38th St NW
- 1210 38th St NW
- 3745 Jackson Dr NW
- 3705 Stonewall Ct NW
- 3740 Crestwood Dr NW
- 1216 38th St NW
- 3751 Jackson Dr NW