1123 E Maplewood Place Orange, CA 92866
Estimated Value: $1,137,000 - $1,429,000
About This Home
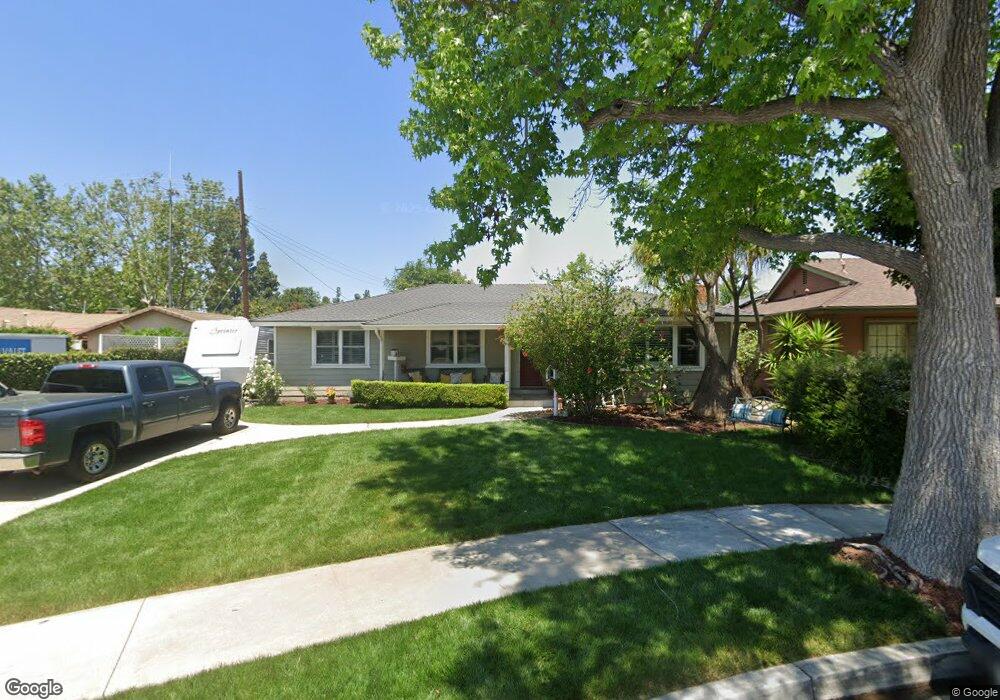
This home is located at 1123 E Maplewood Place, Orange, CA 92866 and is currently estimated at $1,286,173, approximately $735 per square foot. 1123 E Maplewood Place is a home located in Orange County with nearby schools including Cambridge Elementary School, Yorba Middle School, and Orange High School.
Ownership History
We collect this data history from publicly available records. To have your information removed, we recommend requesting removal directly through your county’s website.
Purchase Details
Home Financials for this Owner
Home Financials are based on the most recent Mortgage that was taken out on this home.Home Values in the Area
Average Home Value in this Area
Purchase History
We collect this data history from publicly available records. To have your information removed, we recommend requesting removal directly through your county’s website.
| Date | Buyer | Sale Price | Title Company |
|---|---|---|---|
| $213,000 | Commonwealth Land Title |
Mortgage History
We collect this data history from publicly available records. To have your information removed, we recommend requesting removal directly through your county’s website.
| Date | Status | Borrower | Loan Amount |
|---|---|---|---|
| Closed | $202,350 |
Tax History
We collect this data history from publicly available records. To have your information removed, we recommend requesting removal directly through your county’s website.
| Year | Tax Paid | Tax Assessment Tax Assessment Total Assessment is a certain percentage of the fair market value that is determined by local assessors to be the total taxable value of land and additions on the property. | Land | Improvement |
|---|---|---|---|---|
| 2025 | $4,071 | $362,020 | $231,828 | $130,192 |
| 2024 | $4,071 | $354,922 | $227,282 | $127,640 |
| 2023 | $3,977 | $347,963 | $222,825 | $125,138 |
| 2022 | $3,897 | $341,141 | $218,456 | $122,685 |
| 2021 | $3,790 | $334,452 | $214,172 | $120,280 |
| 2020 | $3,754 | $331,023 | $211,976 | $119,047 |
| 2019 | $3,707 | $324,533 | $207,820 | $116,713 |
| 2018 | $3,650 | $318,170 | $203,745 | $114,425 |
| 2017 | $3,502 | $311,932 | $199,750 | $112,182 |
| 2016 | $3,434 | $305,816 | $195,833 | $109,983 |
| 2015 | $3,383 | $301,223 | $192,892 | $108,331 |
| 2014 | $3,309 | $295,323 | $189,114 | $106,209 |
Map
- 178 N Monterey Rd
- 1314 E Chapman Ave
- 262 N Cambridge St
- 219 S Cambridge St
- 365 N Magnolia St
- 1514 E Palm Ave
- 712 E Washington Ave
- 1519 E Van Bibber Ave
- 1612 E Palmyra Ave
- 637 E Van Bibber Ave
- 822 E Walnut Ave
- 1224 E Orange Grove Ave
- 552 N Cambridge St
- 915 E La Veta Ave
- 1213 E Sunflower Cir Unit 110
- 934 E Rose Ave
- 1306 E Rose Ave
- 354 E Culver Ave
- 1925 E La Veta Ave Unit 65
- 331 N Olive St
- 1134 E Maplewood Place
- 138 N Monterey Rd
- 1116 E Maplewood Place
- 120 N Monterey Rd
- 148 N Monterey Rd
- 1107 E Chapman Ave Unit 208
- 1107 E Chapman Ave
- 1133 E Maplewood Place
- 1104 E Maplewood Place
- 158 N Monterey Rd
- 159 N Maplewood St
- 170 N Monterey Rd
- 169 N Maplewood St
- 1044 E Maplewood Place
- 1132 E Maple Ave
- 179 N Maplewood St
- 1140 E Maple Ave
- 1124 E Maple Ave
- 150 N Maplewood St
- 131 N Monterey Rd
Ask me questions while you tour the home.