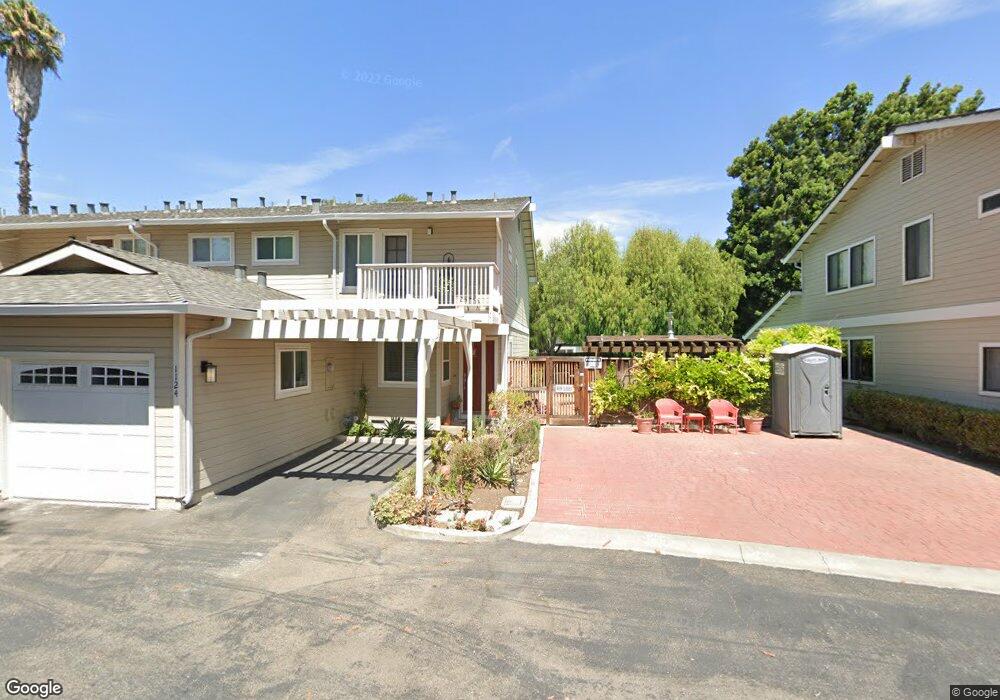
1124 Kayellen Ct San Jose, CA 95125
Willow Glen NeighborhoodEstimated Value: $1,102,000 - $1,336,000
3
Beds
3
Baths
1,780
Sq Ft
$679/Sq Ft
Est. Value
About This Home
This home is located at 1124 Kayellen Ct, San Jose, CA 95125 and is currently estimated at $1,208,054, approximately $678 per square foot. 1124 Kayellen Ct is a home located in Santa Clara County with nearby schools including Willow Glen Elementary, Willow Glen Middle, and Willow Glen High School.
Ownership History
Date
Name
Owned For
Owner Type
Purchase Details
Closed on
Nov 17, 2020
Sold by
Weiser Sylvia
Bought by
Sylvia Weiser 2020 Revocable Trust and Weiser
Current Estimated Value
Purchase Details
Closed on
Sep 2, 1999
Sold by
Trus Luke Charles E
Bought by
Weiser Sylvia
Home Financials for this Owner
Home Financials are based on the most recent Mortgage that was taken out on this home.
Original Mortgage
$254,400
Interest Rate
5.75%
Purchase Details
Closed on
Dec 28, 1998
Sold by
Luke Charles E and Luke Kathleen I
Bought by
Luke Charles E and Luke Kathleen Isaac
Home Financials for this Owner
Home Financials are based on the most recent Mortgage that was taken out on this home.
Original Mortgage
$236,000
Interest Rate
6.73%
Mortgage Type
Stand Alone First
Purchase Details
Closed on
May 15, 1997
Sold by
Luke Charles E and Luke Kathleen I
Bought by
Luke Charles E and Isaac Luke Kathleen
Create a Home Valuation Report for This Property
The Home Valuation Report is an in-depth analysis detailing your home's value as well as a comparison with similar homes in the area
Home Values in the Area
Average Home Value in this Area
Purchase History
| Date | Buyer | Sale Price | Title Company |
|---|---|---|---|
| Sylvia Weiser 2020 Revocable Trust | -- | Weiser Sylvia | |
| Weiser Sylvia | $318,909 | Alliance Title Company | |
| Luke Charles E | -- | Financial Title Company | |
| Luke Charles E | -- | -- |
Source: Public Records
Mortgage History
| Date | Status | Borrower | Loan Amount |
|---|---|---|---|
| Previous Owner | Weiser Sylvia | $254,400 | |
| Previous Owner | Luke Charles E | $236,000 |
Source: Public Records
Tax History Compared to Growth
Tax History
| Year | Tax Paid | Tax Assessment Tax Assessment Total Assessment is a certain percentage of the fair market value that is determined by local assessors to be the total taxable value of land and additions on the property. | Land | Improvement |
|---|---|---|---|---|
| 2025 | $6,206 | $488,353 | $195,338 | $293,015 |
| 2024 | $6,206 | $478,778 | $191,508 | $287,270 |
| 2023 | $6,184 | $469,391 | $187,753 | $281,638 |
| 2022 | $6,149 | $460,188 | $184,072 | $276,116 |
| 2021 | $6,105 | $451,165 | $180,463 | $270,702 |
| 2020 | $6,008 | $446,540 | $178,613 | $267,927 |
| 2019 | $5,895 | $437,785 | $175,111 | $262,674 |
| 2018 | $5,841 | $429,202 | $171,678 | $257,524 |
| 2017 | $5,796 | $420,787 | $168,312 | $252,475 |
| 2016 | $5,651 | $412,537 | $165,012 | $247,525 |
| 2015 | $5,604 | $406,341 | $162,534 | $243,807 |
| 2014 | $5,555 | $398,383 | $159,351 | $239,032 |
Source: Public Records
Map
Nearby Homes
- 975 Prevost St
- 986 Spencer Ave
- 1025 Delmas Ave
- 1206 Clark St
- 1124 Delmas Ave
- 501 Minnesota Ave
- 439 Snyder Ave
- 1249 Prevost St
- 1326 Milton Way
- 546 Coe Ave
- 408 Fuller Ave
- 709 Minnesota Ave
- 1275 Bird Ave
- 470 Jerome St
- 1427 Alma Loop
- 841 Willis Ave
- 935 Chabrant Way
- 1148 Palm St
- 747 Coe Ave
- 652 Fuller Ave
- 1120 Kayellen Ct
- 1116 Kayellen Ct
- 1112 Kayellen Ct
- 1132 Kayellen Ct
- 1105 Prevost Ct
- 1103 Prevost Ct
- 1108 Kayellen Ct
- 1136 Kayellen Ct
- 1107 Prevost Ct
- 1109 Prevost Ct
- 1101 Prevost Ct
- 1140 Kayellen Ct
- 1099 Prevost Ct
- 1113 Prevost Ct
- 1104 Kayellen Ct
- 1097 Prevost Ct
- 642 Willow St
- 1148 Kayellen Ct
- 1114 Clark St
- 1116 Clark St