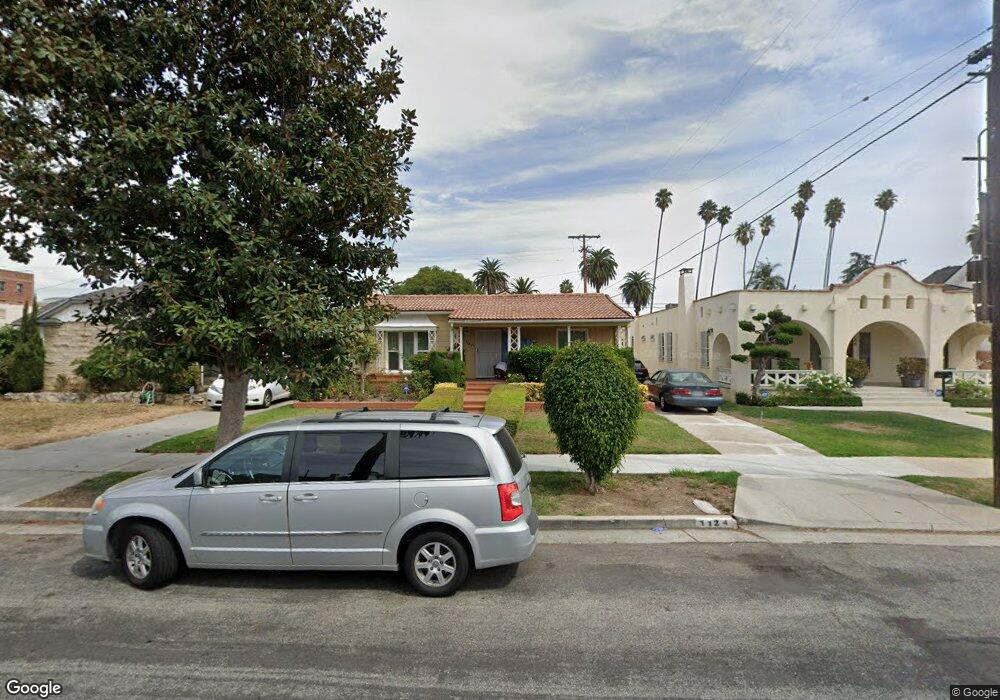
1124 S St Andrews Place Los Angeles, CA 90019
Harvard Heights NeighborhoodEstimated Value: $1,273,078 - $1,483,000
3
Beds
2
Baths
1,980
Sq Ft
$703/Sq Ft
Est. Value
About This Home
This home is located at 1124 S St Andrews Place, Los Angeles, CA 90019 and is currently estimated at $1,391,020, approximately $702 per square foot. 1124 S St Andrews Place is a home located in Los Angeles County with nearby schools including Los Angeles Elementary School, Pio Pico Middle School, and Los Angeles Senior High School.
Ownership History
Date
Name
Owned For
Owner Type
Purchase Details
Closed on
Jun 10, 2002
Sold by
Meade Carlton A
Bought by
Meade Carlton A and Meade Alice M
Current Estimated Value
Purchase Details
Closed on
May 18, 2000
Sold by
Meade Carlton A
Bought by
Meade Carlton A and Meade Family Trust
Purchase Details
Closed on
Mar 5, 1996
Sold by
Coast Federal Bank Fsb
Bought by
Meade Carlton A and Meade Elizabeth
Home Financials for this Owner
Home Financials are based on the most recent Mortgage that was taken out on this home.
Original Mortgage
$143,200
Interest Rate
6.98%
Purchase Details
Closed on
Feb 2, 1996
Sold by
Jones Ronald J
Bought by
Coast Federal Bank Fsb
Home Financials for this Owner
Home Financials are based on the most recent Mortgage that was taken out on this home.
Original Mortgage
$143,200
Interest Rate
6.98%
Purchase Details
Closed on
Jul 17, 1995
Sold by
Jones Annette Maria
Bought by
New England Financial Corp
Create a Home Valuation Report for This Property
The Home Valuation Report is an in-depth analysis detailing your home's value as well as a comparison with similar homes in the area
Home Values in the Area
Average Home Value in this Area
Purchase History
| Date | Buyer | Sale Price | Title Company |
|---|---|---|---|
| Meade Carlton A | -- | -- | |
| Meade Carlton A | -- | -- | |
| Meade Carlton A | -- | -- | |
| Meade Carlton A | $179,000 | Continental Land Title | |
| Coast Federal Bank Fsb | $200,000 | Continental Lawyers Title Co | |
| New England Financial Corp | -- | -- |
Source: Public Records
Mortgage History
| Date | Status | Borrower | Loan Amount |
|---|---|---|---|
| Previous Owner | Meade Carlton A | $143,200 |
Source: Public Records
Tax History Compared to Growth
Tax History
| Year | Tax Paid | Tax Assessment Tax Assessment Total Assessment is a certain percentage of the fair market value that is determined by local assessors to be the total taxable value of land and additions on the property. | Land | Improvement |
|---|---|---|---|---|
| 2025 | $3,864 | $297,337 | $237,382 | $59,955 |
| 2024 | $3,864 | $291,508 | $232,728 | $58,780 |
| 2023 | $3,799 | $285,793 | $228,165 | $57,628 |
| 2022 | $3,635 | $280,191 | $223,692 | $56,499 |
| 2021 | $3,580 | $274,698 | $219,306 | $55,392 |
| 2019 | $3,479 | $266,552 | $212,802 | $53,750 |
| 2018 | $3,374 | $261,327 | $208,630 | $52,697 |
| 2016 | $3,213 | $251,181 | $200,530 | $50,651 |
| 2015 | $3,168 | $247,409 | $197,518 | $49,891 |
| 2014 | $3,189 | $242,563 | $193,649 | $48,914 |
Source: Public Records
Map
Nearby Homes
- 1107 S St Andrews Place
- 1019 S Gramercy Dr
- 3171 W 11th St
- 3061 W 12th Place Unit 101
- 3061 W 12th Place Unit 203
- 1053 S Oxford Ave
- 1132 S Oxford Ave
- 1150 S Oxford Ave Unit 104
- 3020 W 12th St
- 1026 S Oxford Ave Unit 206
- 3036 W 12th Place
- 940 S Gramercy Place
- 1415 S St Andrews Place
- 2989 W 12th St
- 941 S Gramercy Place
- 1056 S Serrano Ave
- 1308 S Van Ness Ave
- 1036 S Serrano Ave Unit 205
- 929 S St Andrews Place Unit 102
- 1028 S Serrano Ave
- 1128 S St Andrews Place
- 1118 S St Andrews Place
- 1134 S St Andrews Place
- 1112 S St Andrews Place
- 1123 S Manhattan Place
- 1129 S Manhattan Place
- 1117 S Manhattan Place
- 1138 S St Andrews Place
- 1106 S St Andrews Place
- 1133 S Manhattan Place
- 1125 S St Andrews Place
- 1117 S St Andrews Place
- 1139 S Manhattan Place
- 1144 S St Andrews Place
- 1107 S Manhattan Place
- 1100 S St Andrews Place
- 1111 S St Andrews Place
- 1135 S St Andrews Place
- 1143 S Manhattan Place Unit 1
- 1143 S Manhattan Place Unit 2