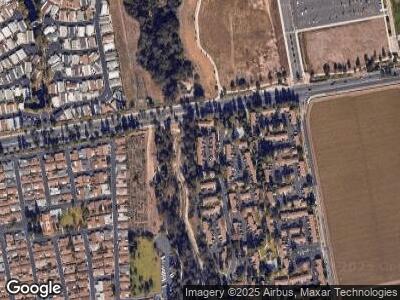
1125 Ibex Square Ventura, CA 93003
Montalvo NeighborhoodEstimated Value: $612,000 - $630,112
About This Home
Welcome to this clean, comfortable, and quiet 3 bedroom 1.5 bathroom townhome. With a bright and open layout, this home is perfect for comfortable living. The downstairs features a spacious living room, dining area and a well-equipped kitchen that leads to a private back patio-perfect for relaxing or entertaining. The patio also houses a convenient laundry closet, complete with patio cover. Upstairs, you'll find three inviting bedrooms and a full bathroom. An attached garage, and the patio is accessible through the driveway, which adds extra convenience. Located in a desirable community with easy access to stores, restaurants and freeways. Very clean Condominium for rent - Quiet area. Walking paths and Kimball Aquatic Center across the street. Orange tree in yard. Soft water. Pool and clubhouse privileges. Larger bedrooms. Airy, relaxing feeling, nice view.
Near Kimball Park, freeway close. Owner paid water, HOA dues and sewer/trash. No smoking or vaping allowed on premises. Automatic
garage door opener. Soft water service included.
Ownership History
Purchase Details
Purchase Details
Home Values in the Area
Average Home Value in this Area
Purchase History
| Date | Buyer | Sale Price | Title Company |
|---|---|---|---|
| Ward Jame Marie | -- | None Available | |
| Ricci Geraldine M | -- | -- |
Mortgage History
| Date | Status | Borrower | Loan Amount |
|---|---|---|---|
| Closed | Ward Jane Marie | $243,000 |
Property History
| Date | Event | Price | Change | Sq Ft Price |
|---|---|---|---|---|
| 03/31/2025 03/31/25 | Off Market | $3,300 | -- | -- |
| 02/23/2025 02/23/25 | For Rent | $3,300 | -- | -- |
Tax History Compared to Growth
Tax History
| Year | Tax Paid | Tax Assessment Tax Assessment Total Assessment is a certain percentage of the fair market value that is determined by local assessors to be the total taxable value of land and additions on the property. | Land | Improvement |
|---|---|---|---|---|
| 2024 | $814 | $67,171 | $10,746 | $56,425 |
| 2023 | $806 | $65,854 | $10,535 | $55,319 |
| 2022 | $754 | $64,563 | $10,328 | $54,235 |
| 2021 | $742 | $63,298 | $10,126 | $53,172 |
| 2020 | $736 | $62,651 | $10,023 | $52,628 |
| 2019 | $721 | $61,424 | $9,827 | $51,597 |
| 2018 | $638 | $60,221 | $9,635 | $50,586 |
| 2017 | $626 | $59,042 | $9,447 | $49,595 |
| 2016 | $615 | $57,885 | $9,262 | $48,623 |
| 2015 | $605 | $57,018 | $9,124 | $47,894 |
| 2014 | $596 | $55,903 | $8,947 | $46,956 |
Map
- 106 Kiwi Way Unit 106
- 175 Chaucer Ln
- 176 Chaucer Ln Unit 176
- 1528 Towhee Ct Unit 138
- 1613 Bassett Ln
- 19 Faulkner Ct
- 19 Faulkner Ct Unit 19
- 8 Chaucer Ln
- 7317 Unicorn Cir
- 206 Browning Ave Unit 206
- 926 Sandberg Ln
- 6941 Dove St
- 583 Doyle Ln
- 773 Sapphire Ave
- 663 Thoreau Ln
- 686 Sapphire Ave
- 7932 Pearl St
- 1796 Swift Ave
- 6986 Harmon Dr
- 6340 Ralston St
- 1125 Ibex Square
- 1123 Ibex Square
- 1127 Ibex Square
- 1121 Ibex Square
- 1129 Ibex Square
- 1105 Ibex Square
- 1103 Ibex Square
- 1107 Ibex Square
- 1131 Ibex Square
- 1109 Ibex Square
- 1111 Ibex Square
- 1101 Ibex Square
- 1135 Ibex Square
- 1119 Ibex Square
- 1117 Ibex Square
- 1137 Ibex Square
- 1133 Ibex Square
- 1115 Ibex Square
- 1139 Ibex Square
- 1113 Ibex Square
