
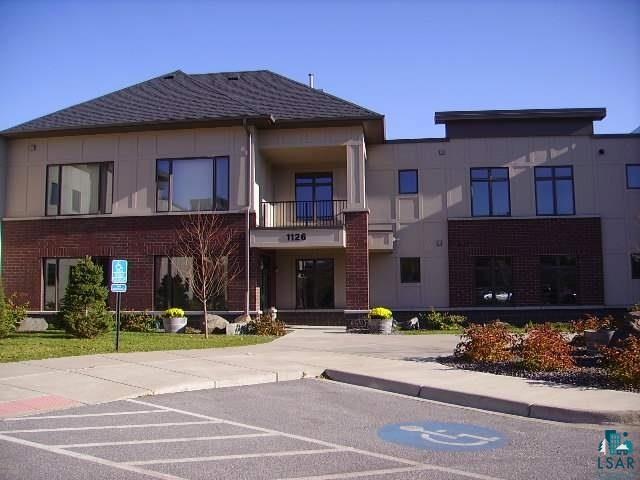
1126 Mesaba Ave Duluth, MN 55811
Kenwood Neighborhood
2
Beds
1
Bath
1,159
Sq Ft
2006
Built
Highlights
- Fitness Center
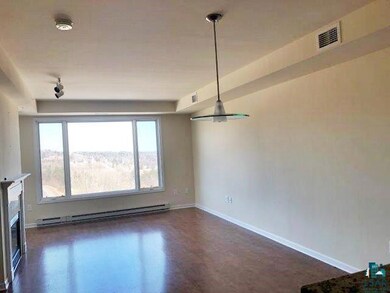
- Panoramic View
- Balcony
- Home Theater
- Elevator
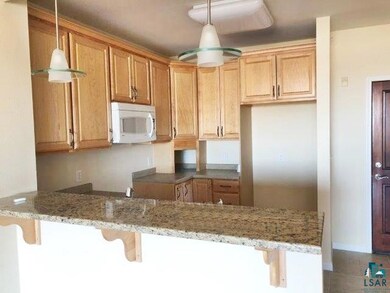
- Breakfast Bar
About This Home
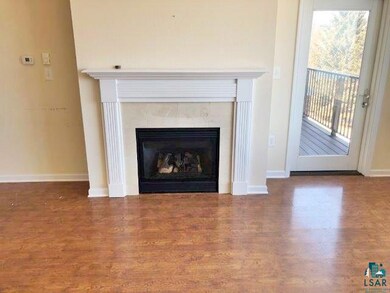
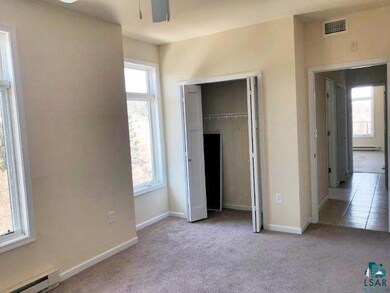
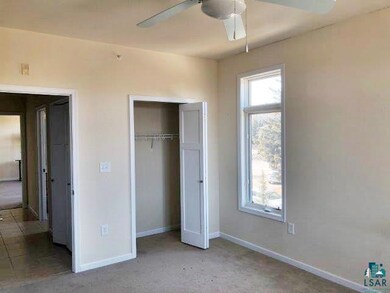
As of August 20242bd/1bth 3rd floor condo in Superior Vista Condominiums. 1 stall tuckunder garage, deck, view of Lake Superior, work out room and game room are common elements.
Home Details
Home Type
- Single Family
Est. Annual Taxes
- $2,850
Year Built
- Built in 2006
HOA Fees
- $315 Monthly HOA Fees
Property Views
- Lake
- Panoramic
- City Lights
Home Design
- Brick Exterior Construction
- Poured Concrete
- Metal Siding
Interior Spaces
- 1,159 Sq Ft Home
- 1-Story Property
- Wired For Data
- Ceiling Fan
- Gas Fireplace
- Combination Dining and Living Room
- Home Theater
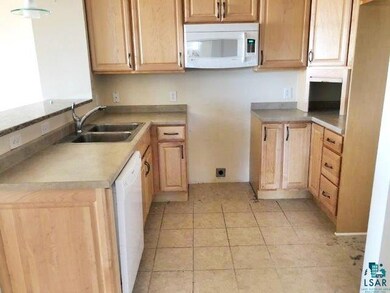
- Tile Flooring
- Breakfast Bar
- Laundry on main level
Bedrooms and Bathrooms
- 2 Bedrooms
- Bathroom on Main Level
- 1 Full Bathroom
Home Security
- Home Security System
- Fire Sprinkler System
Parking
- 1 Car Garage
- Tuck Under Garage
- Garage Door Opener
Utilities
- Central Air
- Heating System Uses Natural Gas
- Baseboard Heating
- Cable TV Available
Additional Features
- Wheelchair Access
- Balcony
Listing and Financial Details
- Assessor Parcel Number 010-4295-00450
Community Details
Overview
- Association fees include exterior maintenance, gas, landscaping, management, parking, security system, shared amenities, snow removal, trash, water, building insurance, lawn care
- Car Wash Area
Amenities
- Recreation Room
- Elevator
Recreation
- Fitness Center
Ownership History
Date
Name
Owned For
Owner Type
Purchase Details
Listed on
Nov 23, 2021
Closed on
Jan 28, 2022
Sold by
Kidder Kenneth and Kidder Carol
Bought by
Gordon Jeffrey and Gordon Nancy
Seller's Agent
Christine Fairchild
RE/MAX Results
Buyer's Agent
Reisa Varin
RE/MAX Results
List Price
$319,900
Sold Price
$319,900
Home Financials for this Owner
Home Financials are based on the most recent Mortgage that was taken out on this home.
Avg. Annual Appreciation
3.02%
Original Mortgage
$255,900
Outstanding Balance
$237,129
Interest Rate
3.22%
Mortgage Type
New Conventional
Estimated Equity
$118,124
Purchase Details
Listed on
Nov 23, 2021
Closed on
Jan 25, 2022
Sold by
Kidder Kenneth B and Kidders Carol C
Bought by
Gordon Jeffrey J and Gordon Nancy K
Seller's Agent
Christine Fairchild
RE/MAX Results
Buyer's Agent
Reisa Varin
RE/MAX Results
List Price
$319,900
Sold Price
$319,900
Home Financials for this Owner
Home Financials are based on the most recent Mortgage that was taken out on this home.
Original Mortgage
$255,900
Outstanding Balance
$237,129
Interest Rate
3.22%
Mortgage Type
New Conventional
Estimated Equity
$118,124
Purchase Details
Closed on
Nov 10, 2006
Sold by
Superior Vista Llc
Bought by
Kidder Kenneth B and Kidder Carol C
Home Financials for this Owner
Home Financials are based on the most recent Mortgage that was taken out on this home.
Original Mortgage
$156,000
Interest Rate
5.87%
Mortgage Type
Purchase Money Mortgage
Similar Homes in Duluth, MN
Create a Home Valuation Report for This Property
The Home Valuation Report is an in-depth analysis detailing your home's value as well as a comparison with similar homes in the area
Home Values in the Area
Average Home Value in this Area
Purchase History
| Date | Type | Sale Price | Title Company |
|---|---|---|---|
| Deed | $319,900 | -- | |
| Warranty Deed | $319,900 | Results Title | |
| Warranty Deed | $319,630 | Ctac |
Source: Public Records
Mortgage History
| Date | Status | Loan Amount | Loan Type |
|---|---|---|---|
| Open | $255,900 | New Conventional | |
| Closed | $255,900 | New Conventional | |
| Previous Owner | $156,000 | Purchase Money Mortgage |
Source: Public Records
Property History
| Date | Event | Price | Change | Sq Ft Price |
|---|---|---|---|---|
| 07/25/2025 07/25/25 | For Sale | $450,000 | -11.2% | $339 / Sq Ft |
| 07/24/2025 07/24/25 | For Sale | $507,000 | +19.3% | $355 / Sq Ft |
| 07/11/2025 07/11/25 | Pending | -- | -- | -- |
| 07/10/2025 07/10/25 | For Sale | $425,000 | -6.6% | $320 / Sq Ft |
| 08/16/2024 08/16/24 | Sold | $455,000 | +2.3% | $343 / Sq Ft |
| 07/25/2024 07/25/24 | Pending | -- | -- | -- |
| 07/24/2024 07/24/24 | For Sale | $444,900 | +30.9% | $335 / Sq Ft |
| 10/20/2023 10/20/23 | Sold | $340,000 | 0.0% | $256 / Sq Ft |
| 09/22/2023 09/22/23 | Pending | -- | -- | -- |
| 09/22/2023 09/22/23 | For Sale | $340,000 | -38.2% | $256 / Sq Ft |
| 08/30/2023 08/30/23 | Sold | $550,000 | 0.0% | $321 / Sq Ft |
| 07/06/2023 07/06/23 | Pending | -- | -- | -- |
| 06/20/2023 06/20/23 | For Sale | $550,000 | +83.3% | $321 / Sq Ft |
| 02/21/2023 02/21/23 | Sold | $300,000 | 0.0% | $226 / Sq Ft |
| 02/03/2023 02/03/23 | Pending | -- | -- | -- |
| 12/19/2022 12/19/22 | For Sale | $300,000 | +7.9% | $226 / Sq Ft |
| 04/04/2022 04/04/22 | Sold | $278,000 | 0.0% | $255 / Sq Ft |
| 02/22/2022 02/22/22 | Pending | -- | -- | -- |
| 02/05/2022 02/05/22 | For Sale | $278,000 | -13.1% | $255 / Sq Ft |
| 01/28/2022 01/28/22 | Sold | $319,900 | 0.0% | $276 / Sq Ft |
| 11/29/2021 11/29/21 | Pending | -- | -- | -- |
| 11/23/2021 11/23/21 | For Sale | $319,900 | +13.0% | $276 / Sq Ft |
| 06/30/2021 06/30/21 | Sold | $283,000 | -1.6% | $213 / Sq Ft |
| 05/01/2021 05/01/21 | Pending | -- | -- | -- |
| 04/16/2021 04/16/21 | Sold | $287,500 | +0.9% | $217 / Sq Ft |
| 04/05/2021 04/05/21 | Sold | $285,000 | -30.5% | $215 / Sq Ft |
| 04/01/2021 04/01/21 | Sold | $410,000 | +43.9% | $239 / Sq Ft |
| 03/15/2021 03/15/21 | Pending | -- | -- | -- |
| 03/10/2021 03/10/21 | For Sale | $285,000 | -17.4% | $215 / Sq Ft |
| 02/16/2021 02/16/21 | Sold | $345,000 | 0.0% | $235 / Sq Ft |
| 02/16/2021 02/16/21 | For Sale | $345,000 | -15.9% | $235 / Sq Ft |
| 02/11/2021 02/11/21 | Pending | -- | -- | -- |
| 02/01/2021 02/01/21 | Pending | -- | -- | -- |
| 01/19/2021 01/19/21 | For Sale | $410,000 | +44.9% | $239 / Sq Ft |
| 12/09/2020 12/09/20 | Pending | -- | -- | -- |
| 12/02/2020 12/02/20 | For Sale | $283,000 | -23.5% | $213 / Sq Ft |
| 11/30/2020 11/30/20 | Sold | $370,000 | +28.7% | $208 / Sq Ft |
| 10/20/2020 10/20/20 | Pending | -- | -- | -- |
| 09/02/2020 09/02/20 | For Sale | $287,500 | -6.4% | $217 / Sq Ft |
| 07/30/2020 07/30/20 | Sold | $307,000 | -2.5% | $231 / Sq Ft |
| 06/12/2020 06/12/20 | Sold | $315,000 | +2.6% | $234 / Sq Ft |
| 06/11/2020 06/11/20 | Pending | -- | -- | -- |
| 06/04/2020 06/04/20 | For Sale | $307,000 | -31.8% | $231 / Sq Ft |
| 04/30/2020 04/30/20 | Sold | $449,900 | +20.6% | $260 / Sq Ft |
| 04/28/2020 04/28/20 | Pending | -- | -- | -- |
| 04/15/2020 04/15/20 | Sold | $373,000 | +35.6% | $221 / Sq Ft |
| 04/15/2020 04/15/20 | Sold | $275,000 | -12.7% | $207 / Sq Ft |
| 03/10/2020 03/10/20 | For Sale | $315,000 | +14.5% | $234 / Sq Ft |
| 02/28/2020 02/28/20 | Pending | -- | -- | -- |
| 02/10/2020 02/10/20 | Pending | -- | -- | -- |
| 01/30/2020 01/30/20 | For Sale | $275,000 | -25.7% | $207 / Sq Ft |
| 01/14/2020 01/14/20 | For Sale | $370,000 | -0.8% | $208 / Sq Ft |
| 01/06/2020 01/06/20 | For Sale | $373,000 | +23.3% | $221 / Sq Ft |
| 11/01/2019 11/01/19 | Sold | $302,500 | +26.0% | $228 / Sq Ft |
| 09/24/2019 09/24/19 | Pending | -- | -- | -- |
| 07/31/2019 07/31/19 | Sold | $240,000 | -46.7% | $220 / Sq Ft |
| 07/22/2019 07/22/19 | Pending | -- | -- | -- |
| 06/25/2019 06/25/19 | Pending | -- | -- | -- |
| 06/14/2019 06/14/19 | For Sale | $449,900 | +48.7% | $260 / Sq Ft |
| 05/06/2019 05/06/19 | For Sale | $302,500 | +26.0% | $228 / Sq Ft |
| 04/17/2019 04/17/19 | For Sale | $240,000 | -17.2% | $220 / Sq Ft |
| 03/05/2019 03/05/19 | Sold | $290,000 | 0.0% | $215 / Sq Ft |
| 01/15/2019 01/15/19 | Pending | -- | -- | -- |
| 01/04/2019 01/04/19 | For Sale | $290,000 | +20.6% | $215 / Sq Ft |
| 12/03/2018 12/03/18 | Sold | $240,550 | -24.8% | $208 / Sq Ft |
| 11/07/2018 11/07/18 | Sold | $320,000 | 0.0% | $241 / Sq Ft |
| 09/27/2018 09/27/18 | Pending | -- | -- | -- |
| 09/04/2018 09/04/18 | For Sale | $320,000 | +20.8% | $241 / Sq Ft |
| 08/31/2018 08/31/18 | Sold | $265,000 | +10.2% | $196 / Sq Ft |
| 08/15/2018 08/15/18 | Pending | -- | -- | -- |
| 07/31/2018 07/31/18 | Pending | -- | -- | -- |
| 04/13/2018 04/13/18 | For Sale | $240,550 | -9.2% | $208 / Sq Ft |
| 03/28/2018 03/28/18 | For Sale | $265,000 | -26.4% | $196 / Sq Ft |
| 03/15/2016 03/15/16 | Sold | $360,000 | 0.0% | $208 / Sq Ft |
| 02/25/2016 02/25/16 | Pending | -- | -- | -- |
| 08/05/2015 08/05/15 | For Sale | $360,000 | -20.9% | $208 / Sq Ft |
| 06/16/2015 06/16/15 | Sold | $455,000 | 0.0% | $263 / Sq Ft |
| 04/17/2015 04/17/15 | Pending | -- | -- | -- |
| 03/17/2015 03/17/15 | For Sale | $455,000 | +85.7% | $263 / Sq Ft |
| 05/28/2014 05/28/14 | Sold | $245,000 | +3.2% | $174 / Sq Ft |
| 04/29/2014 04/29/14 | Pending | -- | -- | -- |
| 04/10/2014 04/10/14 | Sold | $237,500 | -3.1% | $179 / Sq Ft |
| 04/04/2014 04/04/14 | Pending | -- | -- | -- |
| 03/31/2014 03/31/14 | For Sale | $245,000 | -14.0% | $174 / Sq Ft |
| 10/11/2013 10/11/13 | For Sale | $285,000 | -- | $215 / Sq Ft |
Source: Lake Superior Area REALTORS®
Tax History Compared to Growth
Tax History
| Year | Tax Paid | Tax Assessment Tax Assessment Total Assessment is a certain percentage of the fair market value that is determined by local assessors to be the total taxable value of land and additions on the property. | Land | Improvement |
|---|---|---|---|---|
| 2023 | $3,638 | $232,400 | $17,700 | $214,700 |
| 2022 | $3,236 | $232,400 | $17,700 | $214,700 |
| 2021 | $2,748 | $211,800 | $16,100 | $195,700 |
| 2020 | $2,826 | $187,400 | $14,200 | $173,200 |
| 2019 | $2,906 | $187,400 | $14,200 | $173,200 |
| 2018 | $2,710 | $193,000 | $14,200 | $178,800 |
| 2017 | $2,710 | $193,000 | $14,200 | $178,800 |
| 2016 | $2,648 | $193,000 | $14,200 | $178,800 |
| 2015 | $3,757 | $229,000 | $19,700 | $209,300 |
| 2014 | $3,757 | $244,300 | $21,000 | $223,300 |
Source: Public Records
Agents Affiliated with this Home
-
J
Seller's Agent in 2025
Janice Johnson
eXp Realty, LLC
(218) 940-6215
4 in this area
91 Total Sales
-
Seller's Agent in 2025
Brittany Kuschel
Kuschel Realty Group LLC
(218) 260-7744
1 in this area
70 Total Sales
-
S
Seller's Agent in 2025
Shawn Frost
Keller Williams Classic Realty NW
7 Total Sales
-
C
Seller's Agent in 2024
Carol Carlson
Messina & Associates Real Estate
(218) 348-0282
3 in this area
29 Total Sales
-
Buyer's Agent in 2024
Cynthia Hedlund
RE/MAX
(218) 348-2634
2 in this area
39 Total Sales
-
C
Seller's Agent in 2023
Christy Standfield
EasyLiving LLC
(253) 228-1474
1 in this area
24 Total Sales
Map
Source: Lake Superior Area REALTORS®
MLS Number: 6074147
APN: 010429500300
Nearby Homes
- 1126 Mesaba Ave Unit 320
- 1126 Mesaba Ave Unit 118
- XXX E 13th St
- 426 E 13th St
- 621 E 10th St
- 627 E Skyline Pkwy
- 608 E 10th St
- 702 E 11th St
- 808 N 6th Ave E
- 227 E 7th St
- 1356 Fern Ave
- 612 E 8th St
- 202 E 7th St
- 602 E 7th St
- 416 E 6th St
- 1410 N 7th Ave E
- 22X E 8th St
- 908 E Skyline Pkwy
- 531 N 7th Ave E
- 901 E 9th St