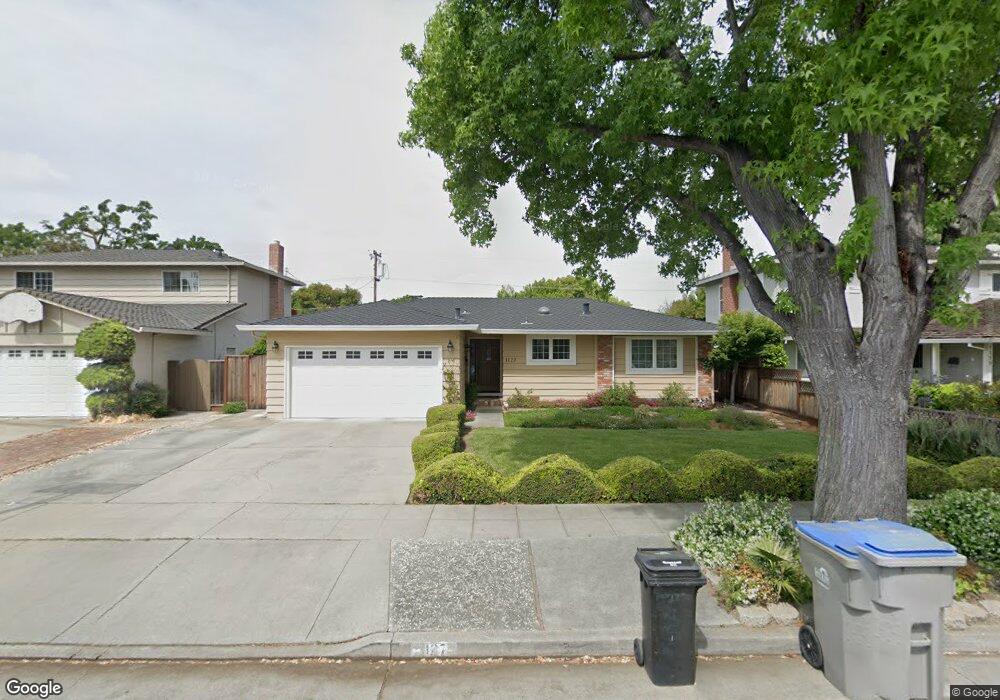
1127 Ginger Ln San Jose, CA 95128
Fruitdale NeighborhoodEstimated Value: $1,583,000 - $1,699,000
3
Beds
2
Baths
1,389
Sq Ft
$1,185/Sq Ft
Est. Value
About This Home
This home is located at 1127 Ginger Ln, San Jose, CA 95128 and is currently estimated at $1,645,552, approximately $1,184 per square foot. 1127 Ginger Ln is a home located in Santa Clara County with nearby schools including Del Mar High School, Sherman Oaks Elementary School, and Blackford Elementary.
Ownership History
Date
Name
Owned For
Owner Type
Purchase Details
Closed on
May 28, 2008
Sold by
Tieu Louis and Tieu Chie B
Bought by
Tieu Louis and Tieu Chie B
Current Estimated Value
Purchase Details
Closed on
Jun 11, 2004
Sold by
Lee William Bunce and Johnson Lee Andrea Rae
Bought by
Tieu Louis and Tieu Chie B
Home Financials for this Owner
Home Financials are based on the most recent Mortgage that was taken out on this home.
Original Mortgage
$492,000
Outstanding Balance
$232,407
Interest Rate
5.5%
Mortgage Type
Purchase Money Mortgage
Estimated Equity
$1,413,145
Purchase Details
Closed on
Feb 19, 2000
Sold by
William Lee and William Andrea J
Bought by
Lee William Bunce and Johnson Lee Andrea Rae
Purchase Details
Closed on
Apr 23, 1997
Sold by
Nguyen Tao V and Jen Jennifer
Bought by
Lee William and Lee Andrea Johnson
Home Financials for this Owner
Home Financials are based on the most recent Mortgage that was taken out on this home.
Original Mortgage
$289,700
Interest Rate
8%
Create a Home Valuation Report for This Property
The Home Valuation Report is an in-depth analysis detailing your home's value as well as a comparison with similar homes in the area
Home Values in the Area
Average Home Value in this Area
Purchase History
| Date | Buyer | Sale Price | Title Company |
|---|---|---|---|
| Tieu Louis | -- | None Available | |
| Tieu Louis | $615,000 | Alliance Title Company | |
| Lee William Bunce | -- | -- | |
| Lee William | $305,000 | First American Title Guarant |
Source: Public Records
Mortgage History
| Date | Status | Borrower | Loan Amount |
|---|---|---|---|
| Open | Tieu Louis | $492,000 | |
| Previous Owner | Lee William | $289,700 | |
| Closed | Tieu Louis | $92,250 |
Source: Public Records
Tax History Compared to Growth
Tax History
| Year | Tax Paid | Tax Assessment Tax Assessment Total Assessment is a certain percentage of the fair market value that is determined by local assessors to be the total taxable value of land and additions on the property. | Land | Improvement |
|---|---|---|---|---|
| 2025 | $11,870 | $874,381 | $612,072 | $262,309 |
| 2024 | $11,870 | $857,237 | $600,071 | $257,166 |
| 2023 | $11,643 | $840,429 | $588,305 | $252,124 |
| 2022 | $11,557 | $823,951 | $576,770 | $247,181 |
| 2021 | $11,325 | $807,796 | $565,461 | $242,335 |
| 2020 | $11,028 | $799,514 | $559,663 | $239,851 |
| 2019 | $10,885 | $783,839 | $548,690 | $235,149 |
| 2018 | $10,585 | $768,471 | $537,932 | $230,539 |
| 2017 | $10,451 | $753,404 | $527,385 | $226,019 |
| 2016 | $9,871 | $738,633 | $517,045 | $221,588 |
| 2015 | $9,737 | $727,539 | $509,279 | $218,260 |
| 2014 | $9,025 | $713,288 | $499,303 | $213,985 |
Source: Public Records
Map
Nearby Homes
- 1023 Delna Manor Ln Unit Lane
- 1189 N Central Ave
- 1006 Almarida Dr
- 919 Ravenscourt Ave
- 1019 Lenor Way
- 1405 Allegado Alley Unit 86
- 138 Quail Hollow Dr Unit 138
- 2067 Sonador Commons
- 2043 Sonador Commons
- 2958 Neet Ave
- 90 Quail Hollow Dr Unit 90
- 744 Teatree Ct
- 1990 Southwest Expy
- 3067 Greentree Way
- 177 Quail Hollow Dr Unit 117
- 26 Quail Hollow Dr Unit 26
- 680 Teatree Ct
- 1445 S Bascom Ave Unit 47
- 160 Quail Hollow Dr Unit 160A
- 1114 S Winchester Blvd Unit 1114
- 1119 Ginger Ln
- 1135 Ginger Ln
- 1111 Ginger Ln
- 1143 Ginger Ln
- 1124 Empey Way
- 1108 Empey Way
- 1132 Empey Way
- 1128 Ginger Ln
- 1138 Ginger Ln
- 1140 Empey Way
- 1100 Empey Way
- 1103 Ginger Ln
- 1149 Ginger Ln
- 2449 Quantico Ct
- 1144 Ginger Ln
- 1092 Empey Way
- 477 Downing Ave
- 1095 Ginger Ln
- 2440 Quantico Ct
- 2441 Quantico Ct