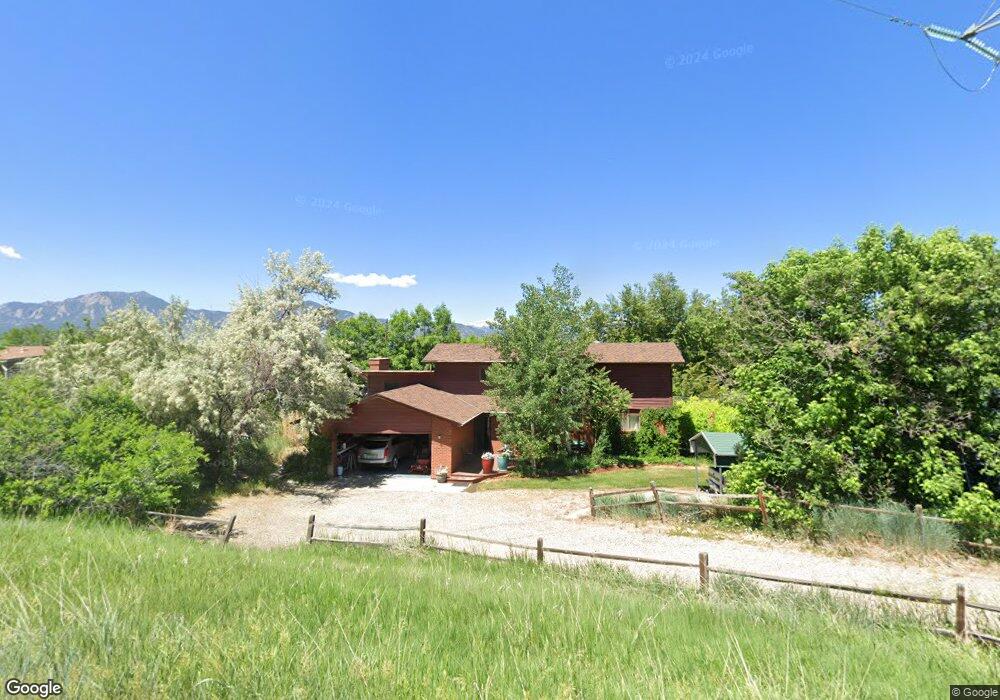
1127 Westview Dr Boulder, CO 80303
Southeast Boulder NeighborhoodEstimated Value: $892,150 - $1,117,000
3
Beds
3
Baths
1,580
Sq Ft
$619/Sq Ft
Est. Value
About This Home
This home is located at 1127 Westview Dr, Boulder, CO 80303 and is currently estimated at $978,538, approximately $619 per square foot. 1127 Westview Dr is a home located in Boulder County with nearby schools including Douglass Elementary School, Nevin Platt Middle School, and Fairview High School.
Ownership History
Date
Name
Owned For
Owner Type
Purchase Details
Closed on
Sep 10, 1998
Sold by
Loring Opal Oleta
Bought by
Loring Mark
Current Estimated Value
Purchase Details
Closed on
Jul 10, 1989
Bought by
Loring Mark E
Purchase Details
Closed on
Sep 22, 1983
Bought by
Loring Mark E
Purchase Details
Closed on
Jan 11, 1979
Bought by
Loring Mark E
Create a Home Valuation Report for This Property
The Home Valuation Report is an in-depth analysis detailing your home's value as well as a comparison with similar homes in the area
Home Values in the Area
Average Home Value in this Area
Purchase History
| Date | Buyer | Sale Price | Title Company |
|---|---|---|---|
| Loring Mark | $10,000 | -- | |
| Loring Mark E | $27,000 | -- | |
| Loring Mark E | $90,000 | -- | |
| Loring Mark E | $68,000 | -- |
Source: Public Records
Tax History
| Year | Tax Paid | Tax Assessment Tax Assessment Total Assessment is a certain percentage of the fair market value that is determined by local assessors to be the total taxable value of land and additions on the property. | Land | Improvement |
|---|---|---|---|---|
| 2025 | $4,803 | $54,787 | $29,606 | $25,181 |
| 2024 | $4,803 | $54,787 | $29,606 | $25,181 |
| 2023 | $4,734 | $55,108 | $24,696 | $34,096 |
| 2022 | $4,085 | $46,016 | $21,357 | $24,659 |
| 2021 | $3,915 | $47,340 | $21,972 | $25,368 |
| 2020 | $3,616 | $42,736 | $22,666 | $20,070 |
| 2019 | $3,561 | $42,736 | $22,666 | $20,070 |
| 2018 | $3,742 | $37,044 | $19,224 | $17,820 |
| 2017 | $3,642 | $40,954 | $21,253 | $19,701 |
| 2016 | $3,290 | $32,246 | $23,402 | $8,844 |
| 2015 | $3,110 | $27,326 | $16,238 | $11,088 |
| 2014 | $3,092 | $27,326 | $16,238 | $11,088 |
Source: Public Records
Map
Nearby Homes
- 6221 Songbird Cir
- 6137 Baseline Rd
- 819 Gapter Rd
- 5648 Baseline Rd
- 7746 Arlington Dr
- 979 Roxwood Ln Unit 3
- 5550 Stonewall Place Unit 33
- 2148 75th St
- 816 Sycamore Ave
- 303 Sky Lark Way
- 655 Cree Cir
- 621 Wewoka Dr
- 7859 Raven Ct
- 520 Wewoka Dr
- 7313 S Boulder Rd
- 600 Manhattan Dr Unit A7
- 600 Manhattan Dr Unit C7
- 665 Manhattan Dr Unit 9
- 5016 Forsythe Place
- 695 Manhattan Dr Unit 109
- 1130 Ridglea Way
- 1111 Westview Dr
- 1140 Ridglea Way
- 1104 Westview Dr
- 1135 Westview Dr
- 1120 Ridglea Way
- 1132 Westview Dr
- 1150 Ridglea Way
- 1146 Westview Dr
- 6599 Stearns Ave
- 6581 Stearns Ave
- 1225 Westview Dr
- 1129 Ridglea Way
- 1139 Ridglea Way
- 1119 Ridglea Way
- 1245 Ridglea Way
- 1107 Crestmoor Dr
- 1076 Westview Dr
- 1109 Ridglea Way
- 1160 Ridglea Way
Your Personal Tour Guide
Ask me questions while you tour the home.