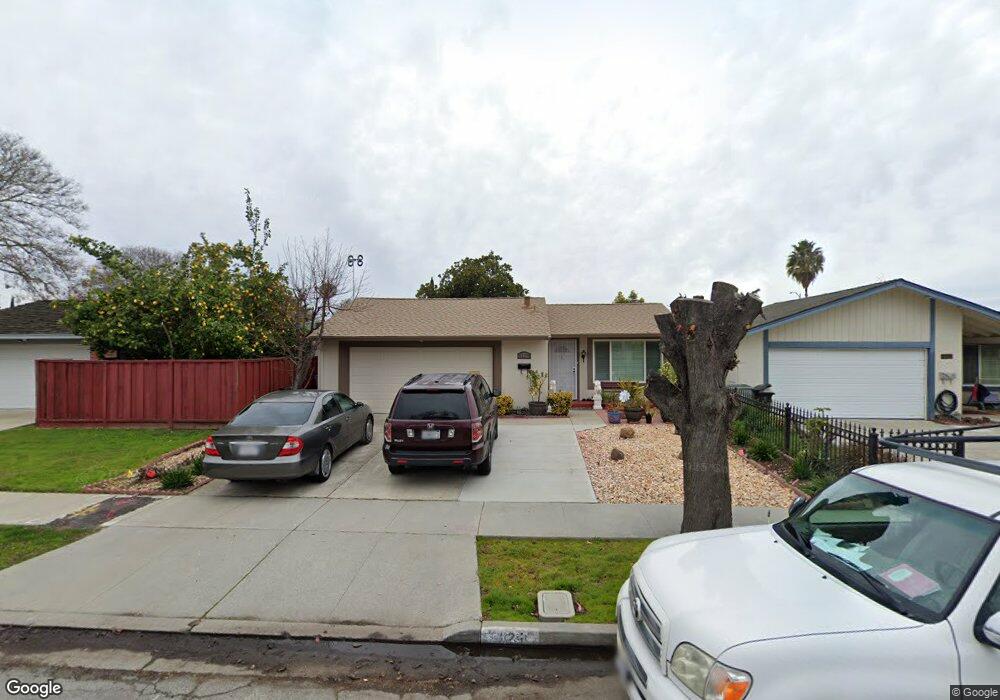
1129 Lightland Rd San Jose, CA 95121
Ramblewood NeighborhoodEstimated Value: $934,000 - $1,114,000
3
Beds
2
Baths
1,220
Sq Ft
$857/Sq Ft
Est. Value
About This Home
This home is located at 1129 Lightland Rd, San Jose, CA 95121 and is currently estimated at $1,045,366, approximately $856 per square foot. 1129 Lightland Rd is a home located in Santa Clara County with nearby schools including Ramblewood Elementary School, Sylvandale Middle School, and Andrew P. Hill High School.
Ownership History
Date
Name
Owned For
Owner Type
Purchase Details
Closed on
Sep 19, 2022
Sold by
Trung Pham Andrew and Tran Thai
Bought by
Pham-Nguyen Familyliving Trust
Current Estimated Value
Purchase Details
Closed on
Jun 30, 2015
Sold by
Bui Khiem and Bui Theresa
Bought by
Pham Andrew T and Nguyen Thai P
Home Financials for this Owner
Home Financials are based on the most recent Mortgage that was taken out on this home.
Original Mortgage
$320,000
Interest Rate
3.98%
Mortgage Type
New Conventional
Purchase Details
Closed on
Mar 20, 2013
Sold by
Pham Andrew T and Nguyen Thai P
Bought by
Pham Andrew T and Nguyen Thai P
Home Financials for this Owner
Home Financials are based on the most recent Mortgage that was taken out on this home.
Original Mortgage
$262,000
Interest Rate
3.49%
Mortgage Type
New Conventional
Purchase Details
Closed on
Dec 14, 2009
Sold by
Nguyen Thai Phuong T
Bought by
Pham Andrew T
Home Financials for this Owner
Home Financials are based on the most recent Mortgage that was taken out on this home.
Original Mortgage
$284,400
Interest Rate
5.01%
Mortgage Type
New Conventional
Purchase Details
Closed on
Dec 8, 2009
Sold by
Evangelista Roman and Evangelista Nicefora
Bought by
Pham Andrew T and Bui Khiem
Home Financials for this Owner
Home Financials are based on the most recent Mortgage that was taken out on this home.
Original Mortgage
$284,400
Interest Rate
5.01%
Mortgage Type
New Conventional
Purchase Details
Closed on
Nov 8, 2006
Sold by
Cones Valerie and Cones Greg
Bought by
Evangelista Roman and Evangelista Nicefora
Home Financials for this Owner
Home Financials are based on the most recent Mortgage that was taken out on this home.
Original Mortgage
$573,000
Interest Rate
1.62%
Mortgage Type
Negative Amortization
Purchase Details
Closed on
May 21, 2004
Sold by
Tsang Simon and Tsang Daisy
Bought by
Cones Greg and Cones Valerie
Home Financials for this Owner
Home Financials are based on the most recent Mortgage that was taken out on this home.
Original Mortgage
$248,300
Interest Rate
6.27%
Mortgage Type
Purchase Money Mortgage
Purchase Details
Closed on
Aug 16, 2000
Sold by
Low Brian P
Bought by
Tsang Simon and Tsang Daisy
Home Financials for this Owner
Home Financials are based on the most recent Mortgage that was taken out on this home.
Original Mortgage
$262,400
Interest Rate
8.7%
Create a Home Valuation Report for This Property
The Home Valuation Report is an in-depth analysis detailing your home's value as well as a comparison with similar homes in the area
Home Values in the Area
Average Home Value in this Area
Purchase History
| Date | Buyer | Sale Price | Title Company |
|---|---|---|---|
| Pham-Nguyen Familyliving Trust | -- | -- | |
| Pham Andrew T | $202,000 | Old Republic Title Company | |
| Pham Andrew T | -- | Old Republic Title Company | |
| Pham Andrew T | -- | Old Republic Title Company | |
| Pham Andrew T | -- | Fidelity National Title Co | |
| Pham Andrew T | $360,000 | Fidelity National Title Co | |
| Evangelista Roman | $638,000 | Old Republic Title Company | |
| Cones Greg | $340,000 | Chicago Title | |
| Tsang Simon | $328,000 | Chicago Title Co |
Source: Public Records
Mortgage History
| Date | Status | Borrower | Loan Amount |
|---|---|---|---|
| Previous Owner | Pham Andrew T | $320,000 | |
| Previous Owner | Pham Andrew T | $262,000 | |
| Previous Owner | Pham Andrew T | $284,400 | |
| Previous Owner | Evangelista Roman | $573,000 | |
| Previous Owner | Cones Greg | $248,300 | |
| Previous Owner | Tsang Simon | $262,400 | |
| Closed | Cones Greg | $25,000 |
Source: Public Records
Tax History Compared to Growth
Tax History
| Year | Tax Paid | Tax Assessment Tax Assessment Total Assessment is a certain percentage of the fair market value that is determined by local assessors to be the total taxable value of land and additions on the property. | Land | Improvement |
|---|---|---|---|---|
| 2025 | $8,825 | $575,634 | $376,161 | $199,473 |
| 2024 | $8,825 | $564,348 | $368,786 | $195,562 |
| 2023 | $8,708 | $553,283 | $361,555 | $191,728 |
| 2022 | $8,430 | $542,435 | $354,466 | $187,969 |
| 2021 | $8,384 | $531,800 | $347,516 | $184,284 |
| 2020 | $8,099 | $526,348 | $343,953 | $182,395 |
| 2019 | $10,310 | $516,028 | $337,209 | $178,819 |
| 2018 | $10,294 | $505,911 | $330,598 | $175,313 |
| 2017 | $10,172 | $495,992 | $324,116 | $171,876 |
| 2016 | $9,795 | $486,267 | $317,761 | $168,506 |
| 2015 | $5,953 | $386,646 | $231,988 | $154,658 |
| 2014 | $5,486 | $379,073 | $227,444 | $151,629 |
Source: Public Records
Map
Nearby Homes
- 3843 Marfrance Dr
- 3891 Marfrance Dr
- 3699 Cedar Knoll Ct
- 4171 Ambler Way
- 1520 E Capitol Expy
- 1520 E Capitol Expy Unit 29
- 3354 Shadow Park Place Unit 319
- 3326 Shadow Park Place
- 3241 Shadow Park Place
- 3463 Sugarcreek Ct
- 3461 Senter Rd
- 573 Bamboo Ct
- 3233 Lone Bluff Way
- 3016 Shadow Springs Place Unit 113
- 572 Groth Dr
- 3262 Sagittarius Ln
- 491 Ginkgo Ct
- 523 Sieber Place
- 4219 Senter Rd
- 3128 Shofner Place
- 1143 Lightland Rd
- 1115 Lightland Rd
- 1124 Valdosta Rd
- 1157 Lightland Rd
- 1101 Lightland Rd
- 1134 Valdosta Rd
- 1114 Valdosta Rd
- 1144 Valdosta Rd
- 1104 Valdosta Rd
- 1171 Lightland Rd
- 1130 Lightland Rd
- 1144 Lightland Rd
- 1154 Valdosta Rd
- 1116 Lightland Rd
- 1158 Lightland Rd
- 1185 Lightland Rd
- 1102 Lightland Rd
- 1164 Valdosta Rd
- 1172 Lightland Rd
- 3857 Marfrance Dr