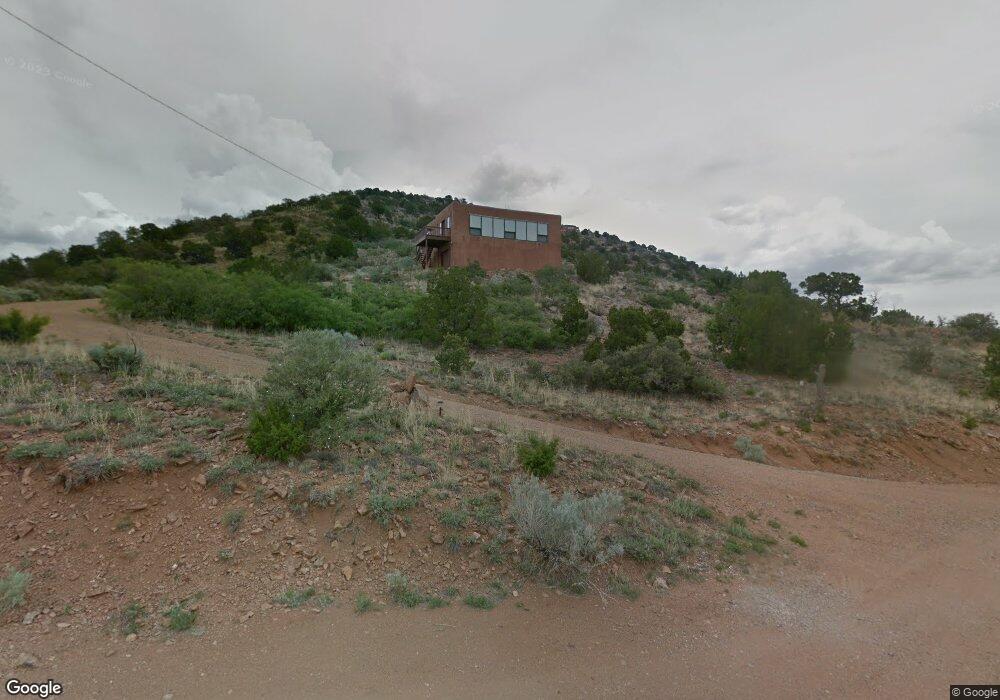
113 Coyote Crossing Santa Fe, NM 87508
Sunlit Hills NeighborhoodEstimated Value: $561,220 - $662,000
3
Beds
2
Baths
1,570
Sq Ft
$382/Sq Ft
Est. Value
About This Home
This home is located at 113 Coyote Crossing, Santa Fe, NM 87508 and is currently estimated at $599,407, approximately $381 per square foot. 113 Coyote Crossing is a home located in Santa Fe County with nearby schools including E.J. Martinez Elementary School and Santa Fe High School.
Ownership History
Date
Name
Owned For
Owner Type
Purchase Details
Closed on
Oct 15, 2019
Sold by
Hungerford Ed V and Hungerford Revocable Trust
Bought by
Boldt Matthew and Lis Sarah
Current Estimated Value
Home Financials for this Owner
Home Financials are based on the most recent Mortgage that was taken out on this home.
Original Mortgage
$365,750
Outstanding Balance
$319,756
Interest Rate
3.4%
Mortgage Type
New Conventional
Estimated Equity
$279,651
Purchase Details
Closed on
Jun 22, 2012
Sold by
Hungerford Ed V and Hungerford Mary D
Bought by
Hungerford Ed V and Hungerford Mary D
Purchase Details
Closed on
Oct 28, 2005
Sold by
Michaels Micaela
Bought by
Hungerford Ed V and Hungerford Mary D
Home Financials for this Owner
Home Financials are based on the most recent Mortgage that was taken out on this home.
Original Mortgage
$255,000
Interest Rate
5.37%
Mortgage Type
Fannie Mae Freddie Mac
Purchase Details
Closed on
Apr 22, 2002
Sold by
Smith Charles
Bought by
Michaels Micaela
Home Financials for this Owner
Home Financials are based on the most recent Mortgage that was taken out on this home.
Original Mortgage
$204,000
Interest Rate
7.09%
Create a Home Valuation Report for This Property
The Home Valuation Report is an in-depth analysis detailing your home's value as well as a comparison with similar homes in the area
Home Values in the Area
Average Home Value in this Area
Purchase History
| Date | Buyer | Sale Price | Title Company |
|---|---|---|---|
| Boldt Matthew | -- | None Available | |
| Hungerford Ed V | -- | None Available | |
| Hungerford Ed V | -- | First American Title Ins Co | |
| Michaels Micaela | -- | -- |
Source: Public Records
Mortgage History
| Date | Status | Borrower | Loan Amount |
|---|---|---|---|
| Open | Boldt Matthew | $365,750 | |
| Previous Owner | Hungerford Ed V | $255,000 | |
| Previous Owner | Michaels Micaela | $204,000 |
Source: Public Records
Tax History Compared to Growth
Tax History
| Year | Tax Paid | Tax Assessment Tax Assessment Total Assessment is a certain percentage of the fair market value that is determined by local assessors to be the total taxable value of land and additions on the property. | Land | Improvement |
|---|---|---|---|---|
| 2024 | $2,641 | $383,578 | $151,070 | $232,508 |
| 2023 | $2,643 | $372,406 | $146,670 | $225,736 |
| 2022 | $2,574 | $361,561 | $142,399 | $219,162 |
| 2021 | $2,523 | $117,010 | $46,083 | $70,927 |
| 2020 | $2,631 | $121,068 | $48,016 | $73,052 |
| 2019 | $2,141 | $95,969 | $46,023 | $49,946 |
| 2018 | $2,086 | $93,174 | $44,682 | $48,492 |
| 2017 | $2,075 | $93,174 | $44,682 | $48,492 |
| 2016 | $2,284 | $106,083 | $61,560 | $44,523 |
| 2015 | $2,240 | $102,993 | $61,560 | $41,433 |
| 2014 | $2,822 | $132,884 | $61,498 | $71,385 |
Source: Public Records
Map
Nearby Homes
- 10 Sabina Ln
- 71 Apache Plume Dr
- 53 Camino Pacifico
- 37 Paseo Del Pinon
- 11 Sierra Lejana
- 6 Vista Del Cerro
- 224 Nine Mile Rd
- 19 Arroyo Trail
- 2 Ute Ln
- 37 Camino Tetzcoco
- 62 and 64 Camino Tetzcoco
- 7 Stacy Rd
- 28 and 29 Sena Ln Unit Lot 4 and 5
- 28 Sena Ln NW Unit Lot 4
- 36 Stacy Rd
- 106 La Ventana Dr
- 117 La Ventana
- 2 Toltec Rd
- 4 High Desert Vista
- 15 Toltec Rd
- 109 Coyote Crossing
- 114 Coyote Crossing
- 115 Coyote Crossing
- 99 Coyote Crossing
- 102 Coyote Crossing
- 30 Vail Rd
- 89 Coyote Crossing
- 122 Nine Mile Rd
- 18 Old Dog Run
- 88 Coyote Crossing
- 108 Nine Mile Rd
- 6 Old Dog Run
- 0 Nine Mile
- 100 Nine Mile Rd
- 18 Sabina Ln
- 19 Vail Rd
- 88 Nine Mile Rd
- 64 Coyote Crossing
- 96 Nine Mile Rd
- 132 9 Mile Rd Unit A