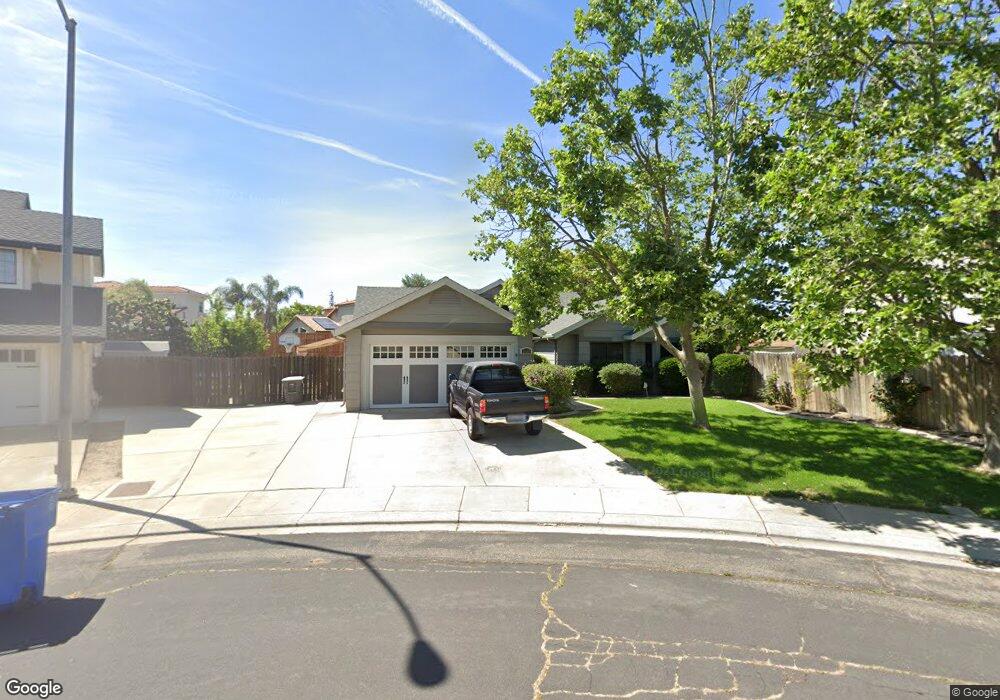
1133 Canvasback Ln Manteca, CA 95337
Downtown Manteca NeighborhoodEstimated Value: $515,000 - $611,000
4
Beds
2
Baths
1,837
Sq Ft
$306/Sq Ft
Est. Value
About This Home
This home is located at 1133 Canvasback Ln, Manteca, CA 95337 and is currently estimated at $562,207, approximately $306 per square foot. 1133 Canvasback Ln is a home located in San Joaquin County with nearby schools including Sequoia Elementary School and Manteca High School.
Ownership History
Date
Name
Owned For
Owner Type
Purchase Details
Closed on
Sep 18, 2003
Sold by
Sequeira Deborah F and Sequiera Deborah F
Bought by
Sequeira Deborah F
Current Estimated Value
Purchase Details
Closed on
Oct 13, 2000
Sold by
Lafond Kenneth E
Bought by
Sequiera Deborah F
Home Financials for this Owner
Home Financials are based on the most recent Mortgage that was taken out on this home.
Original Mortgage
$177,350
Outstanding Balance
$64,862
Interest Rate
7.96%
Estimated Equity
$497,345
Purchase Details
Closed on
Aug 18, 1998
Sold by
Martinsen Steven E and Martinsen Kendra D
Bought by
Lafond Kenneth E
Home Financials for this Owner
Home Financials are based on the most recent Mortgage that was taken out on this home.
Original Mortgage
$170,050
Interest Rate
6.88%
Purchase Details
Closed on
Jun 23, 1995
Sold by
Abreu Anthony J and Abreu Maria S
Bought by
Martinsen Steven E and Martinsen Kendra D
Home Financials for this Owner
Home Financials are based on the most recent Mortgage that was taken out on this home.
Original Mortgage
$135,850
Interest Rate
7.59%
Purchase Details
Closed on
Sep 12, 1994
Sold by
Abreu Anthony J and Abreu Maria S
Bought by
Abreu Anthony J and Abreu Maria S
Create a Home Valuation Report for This Property
The Home Valuation Report is an in-depth analysis detailing your home's value as well as a comparison with similar homes in the area
Home Values in the Area
Average Home Value in this Area
Purchase History
| Date | Buyer | Sale Price | Title Company |
|---|---|---|---|
| Sequeira Deborah F | -- | -- | |
| Sequiera Deborah F | $222,000 | Chicago Title Co | |
| Lafond Kenneth E | $179,000 | First American Title Co | |
| Martinsen Steven E | $143,000 | First American | |
| Abreu Anthony J | -- | -- |
Source: Public Records
Mortgage History
| Date | Status | Borrower | Loan Amount |
|---|---|---|---|
| Open | Sequiera Deborah F | $177,350 | |
| Previous Owner | Lafond Kenneth E | $170,050 | |
| Previous Owner | Martinsen Steven E | $135,850 | |
| Closed | Sequiera Deborah F | $33,250 |
Source: Public Records
Tax History
| Year | Tax Paid | Tax Assessment Tax Assessment Total Assessment is a certain percentage of the fair market value that is determined by local assessors to be the total taxable value of land and additions on the property. | Land | Improvement |
|---|---|---|---|---|
| 2025 | $3,727 | $334,042 | $67,800 | $266,242 |
| 2024 | $3,622 | $327,493 | $66,471 | $261,022 |
| 2023 | $3,579 | $321,072 | $65,168 | $255,904 |
| 2022 | $3,525 | $314,778 | $63,891 | $250,887 |
| 2021 | $3,487 | $308,607 | $62,639 | $245,968 |
| 2020 | $3,346 | $305,443 | $61,997 | $243,446 |
| 2019 | $3,302 | $299,455 | $60,782 | $238,673 |
| 2018 | $3,259 | $293,585 | $59,591 | $233,994 |
| 2017 | $3,211 | $287,829 | $58,423 | $229,406 |
| 2016 | $3,134 | $282,186 | $57,277 | $224,909 |
| 2014 | $2,913 | $272,507 | $55,313 | $217,194 |
Source: Public Records
Map
Nearby Homes
- 896 Cinnamon Teal Ct
- 938 Snowgoose Ln
- 1015 Tenaya Ct
- 865 Locust Ave
- 776 Folsom Way
- 778 Mission Ridge Dr
- 578 Schooner Place
- 1164 Marion St
- 1142 Mammoth Dr
- 707 Chenin Blanc Dr
- 1432 Driftwood Way
- 1025 Barbados St
- 628 Mission Ridge Dr
- 1176 Junction Dr
- 1432 Meridian St
- 1444 Meridian St
- 1555 Sand Ln
- 1821 Avo Way
- 1676 Red Ribbons Ln
- 119 Almond Ave
- 1115 Canvasback Ln
- 1139 Canvasback Ln
- 1171 Williams Ct
- 1176 Williams Ct
- 1154 Mission Ridge Dr
- 1146 Mission Ridge Dr
- 1138 Mission Ridge Dr
- 1151 Canvasback Ln
- 1134 Canvasback Ln
- 1175 Williams Ct
- 1130 Mission Ridge Dr
- 1166 Mission Ridge Dr
- 1180 Williams Ct
- 1157 Canvasback Ln
- 1132 S Union Rd
- 1172 Mission Ridge Dr
- 1118 Canvasback Ln
- 1181 Mallard Ct
- 1183 Williams Ct
- 1128 S Union Rd
Your Personal Tour Guide
Ask me questions while you tour the home.