Estimated Value: $854,540 - $1,033,000
4
Beds
4
Baths
2,269
Sq Ft
$422/Sq Ft
Est. Value
About This Home
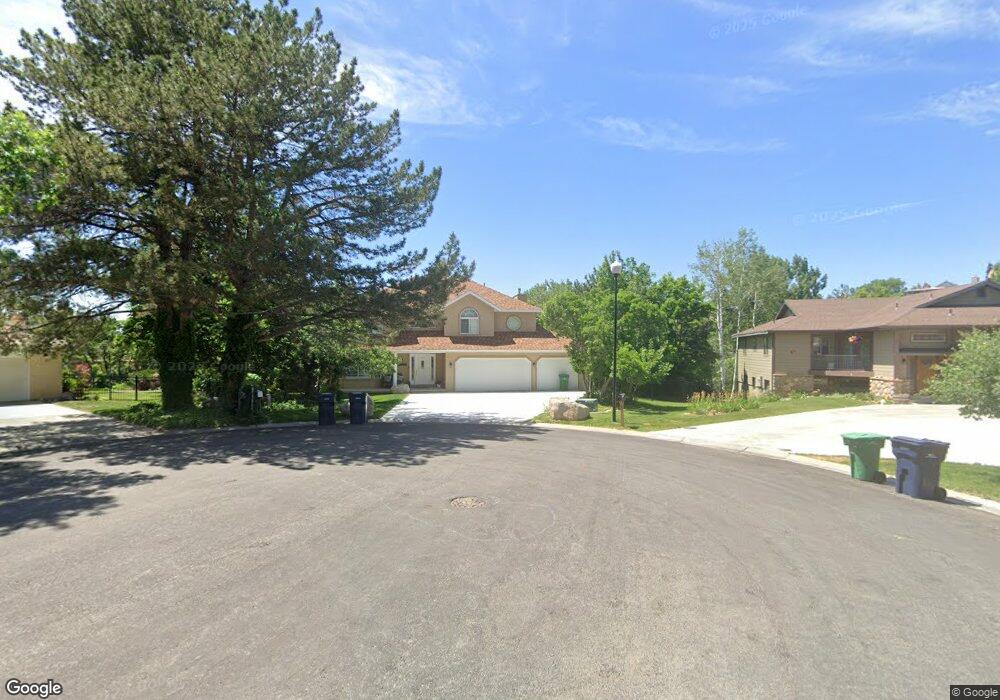
This home is located at 11338 Willow Brook Cir, Sandy, UT 84092 and is currently estimated at $958,135, approximately $422 per square foot. 11338 Willow Brook Cir is a home located in Salt Lake County with nearby schools including Bell Canyon Montessori School and Challenger School - Sandy.
Ownership History
Date
Name
Owned For
Owner Type
Purchase Details
Closed on
Oct 22, 2018
Sold by
Heaton Kevin G and Heaton Suzanne W
Bought by
Heaton Kevin George and Heaton Suzanne W
Current Estimated Value
Home Financials for this Owner
Home Financials are based on the most recent Mortgage that was taken out on this home.
Original Mortgage
$200,000
Outstanding Balance
$124,574
Interest Rate
4.6%
Mortgage Type
Credit Line Revolving
Estimated Equity
$833,561
Purchase Details
Closed on
Aug 20, 2015
Sold by
Heaton Kevin George and Heaton Suzanne
Bought by
Heaton Family Trust
Purchase Details
Closed on
Nov 17, 2000
Sold by
Adams Gregory J and Adams Laura H
Bought by
Adams Gregory J and Adams Laura H
Purchase Details
Closed on
Jul 28, 1995
Sold by
Evans Mark B
Bought by
Heaton Kevin and Heaton Suzanne
Home Financials for this Owner
Home Financials are based on the most recent Mortgage that was taken out on this home.
Original Mortgage
$130,000
Interest Rate
7.62%
Create a Home Valuation Report for This Property
The Home Valuation Report is an in-depth analysis detailing your home's value as well as a comparison with similar homes in the area
Home Values in the Area
Average Home Value in this Area
Purchase History
| Date | Buyer | Sale Price | Title Company |
|---|---|---|---|
| Heaton Kevin George | -- | Meridian Title | |
| Heaton Kevin G | -- | Meridian Title | |
| Heaton Family Trust | -- | None Available | |
| Adams Gregory J | -- | -- | |
| Heaton Kevin | -- | -- |
Source: Public Records
Mortgage History
| Date | Status | Borrower | Loan Amount |
|---|---|---|---|
| Open | Heaton Kevin G | $200,000 | |
| Previous Owner | Heaton Kevin | $130,000 |
Source: Public Records
Tax History
| Year | Tax Paid | Tax Assessment Tax Assessment Total Assessment is a certain percentage of the fair market value that is determined by local assessors to be the total taxable value of land and additions on the property. | Land | Improvement |
|---|---|---|---|---|
| 2025 | $4,186 | $822,000 | $395,800 | $426,200 |
| 2024 | $4,186 | $774,100 | $381,000 | $393,100 |
| 2023 | $4,186 | $765,800 | $366,400 | $399,400 |
| 2022 | $4,113 | $741,000 | $334,500 | $406,500 |
| 2021 | $3,716 | $569,800 | $257,900 | $311,900 |
| 2020 | $3,580 | $517,600 | $257,900 | $259,700 |
| 2019 | $3,470 | $488,900 | $243,400 | $245,500 |
| 2018 | $3,145 | $461,400 | $243,400 | $218,000 |
| 2017 | $3,029 | $424,500 | $243,400 | $181,100 |
| 2016 | $2,828 | $383,100 | $219,400 | $163,700 |
| 2015 | $2,906 | $364,300 | $231,400 | $132,900 |
| 2014 | $2,815 | $346,000 | $225,400 | $120,600 |
Source: Public Records
Map
Nearby Homes
- 2234 E Willow Brook Way
- 11129 S 2125 E
- 2250 High Mountain Dr
- 2192 E High Mesa Dr
- 11446 S 2320 E
- 7 Rollingwood Ln
- 2232 E Lone Eagle Ln
- 1 Quietwood Ln
- 16 Gatehouse Ln
- 5 Quietwood Ln
- 11318 Canyon Falls Ln
- 35 E Lone Hollow Dr
- 18 Snow Forest Ln
- 2026 E 10765 S
- 1 Cross Hill Ln
- 2342 Charros Rd
- 10665 S 2340 E
- 3 Snow Forest Cove Unit 1039
- 1653 Crescent View Dr
- 11551 S Woodhampton Dr
- 11313 High Mesa Dr
- 11340 Willow Brook Cir
- 11313 S High Mesa Dr Unit 12+
- 11303 High Mesa Dr Unit 12
- 14 Lone Hollow Dr
- 11331 S 2235 E
- 11329 Willow Brook Cir
- 11317 S High Mesa Dr
- 11317 S High Mesa Dr
- 11331 Willow Brook Cir
- 15 Lone Hollow
- 11350 S 2235 E
- 11350 Willow Brook Cir
- 2217 E Willow Brook Way
- 11345 Willow Brook Cir
- 2217 Willow Brook Way
- 15 E Lone Hollow
- 2148 E 11270 S
- 2207 Willow Brook Way
- 11325 High Mesa Dr
Your Personal Tour Guide
Ask me questions while you tour the home.