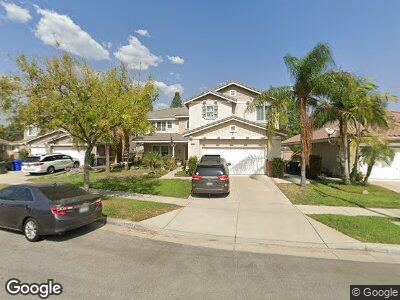
11342 Fulbourn Ct Rancho Cucamonga, CA 91730
Terra Vista NeighborhoodEstimated Value: $1,028,113 - $1,224,000
6
Beds
3
Baths
3,631
Sq Ft
$309/Sq Ft
Est. Value
About This Home
This home is located at 11342 Fulbourn Ct, Rancho Cucamonga, CA 91730 and is currently estimated at $1,121,278, approximately $308 per square foot. 11342 Fulbourn Ct is a home located in San Bernardino County with nearby schools including Terra Vista Elementary, Etiwanda Intermediate, and Rancho Cucamonga High School.
Ownership History
Date
Name
Owned For
Owner Type
Purchase Details
Closed on
Jan 24, 2011
Sold by
Ramirez Maria G
Bought by
Bi Ed and Wang Xiru
Current Estimated Value
Home Financials for this Owner
Home Financials are based on the most recent Mortgage that was taken out on this home.
Original Mortgage
$297,500
Interest Rate
4.77%
Mortgage Type
New Conventional
Purchase Details
Closed on
Mar 7, 2007
Sold by
Eubanks Rosario
Bought by
Ramirez Maria G
Home Financials for this Owner
Home Financials are based on the most recent Mortgage that was taken out on this home.
Original Mortgage
$368,700
Interest Rate
6.29%
Mortgage Type
New Conventional
Purchase Details
Closed on
Mar 4, 2003
Sold by
Kb Home Greater Los Angeles Inc
Bought by
Ramirez Maria G and Eubanks Rosario
Home Financials for this Owner
Home Financials are based on the most recent Mortgage that was taken out on this home.
Original Mortgage
$332,000
Interest Rate
5.79%
Create a Home Valuation Report for This Property
The Home Valuation Report is an in-depth analysis detailing your home's value as well as a comparison with similar homes in the area
Home Values in the Area
Average Home Value in this Area
Purchase History
| Date | Buyer | Sale Price | Title Company |
|---|---|---|---|
| Bi Ed | $430,000 | Stewart Title Of California | |
| Ramirez Maria G | -- | Old Republic Title Company | |
| Ramirez Maria G | $425,500 | First American |
Source: Public Records
Mortgage History
| Date | Status | Borrower | Loan Amount |
|---|---|---|---|
| Open | Bi Ed | $248,000 | |
| Closed | Bi Ed | $285,000 | |
| Closed | Bi Ed | $286,500 | |
| Previous Owner | Bi Ed | $297,500 | |
| Previous Owner | Ramirez Maria G | $368,700 | |
| Previous Owner | Ramirez Maria G | $332,000 |
Source: Public Records
Tax History Compared to Growth
Tax History
| Year | Tax Paid | Tax Assessment Tax Assessment Total Assessment is a certain percentage of the fair market value that is determined by local assessors to be the total taxable value of land and additions on the property. | Land | Improvement |
|---|---|---|---|---|
| 2024 | $6,469 | $540,107 | $135,028 | $405,079 |
| 2023 | $6,302 | $529,516 | $132,380 | $397,136 |
| 2022 | $6,212 | $519,133 | $129,784 | $389,349 |
| 2021 | $6,116 | $508,954 | $127,239 | $381,715 |
| 2020 | $6,042 | $503,735 | $125,934 | $377,801 |
| 2019 | $5,888 | $493,858 | $123,465 | $370,393 |
| 2018 | $5,876 | $484,174 | $121,044 | $363,130 |
| 2017 | $5,782 | $474,681 | $118,671 | $356,010 |
| 2016 | $5,897 | $465,373 | $116,344 | $349,029 |
| 2015 | $5,850 | $458,382 | $114,596 | $343,786 |
| 2014 | $5,730 | $449,403 | $112,351 | $337,052 |
Source: Public Records
Map
Nearby Homes
- 11318 Fitzpatrick Dr
- 11257 Terra Vista Pkwy Unit B
- 11186 Terra Vista Pkwy Unit 116
- 7652 Belpine Place
- 7390 Belpine Place
- 11159 Saint Tropez Dr
- 7353 Ellena W Unit 83
- 7353 Ellena W
- 7252 Turning Leaf Place
- 11090 Mountain View Dr Unit 62
- 11090 Mountain View Dr Unit 39
- 11259 Corsica Ct
- 11433 Mountain View Dr Unit 40
- 11433 Mountain View Dr Unit 62
- 7408 Holloway Rd
- 7279 Cosenza Place
- 7843 Danner Ct
- 11027 Meyers Dr
- 11137 Amarillo St
- 7363 Roxbury Place
- 11342 Fulbourn Ct
- 11352 Fulbourn Ct
- 11334 Fulbourn Ct
- 11362 Fulbourn Ct
- 11330 Fulbourn Ct
- 11353 Fulbourn Ct
- 11343 Fulbourn Ct
- 11370 Fulbourn Ct
- 11327 Fulbourn Ct
- 11335 Fulbourn Ct
- 11363 Fulbourn Ct
- 11329 Fulbourn Ct
- 11380 Fulbourn Ct
- 11373 Fulbourn Ct
- 11352 Fitzpatrick Dr
- 11344 Fitzpatrick Dr
- 11332 Fitzpatrick Dr
- 11388 Fulbourn Ct
- 11364 Fitzpatrick Dr
- 11383 Fulbourn Ct