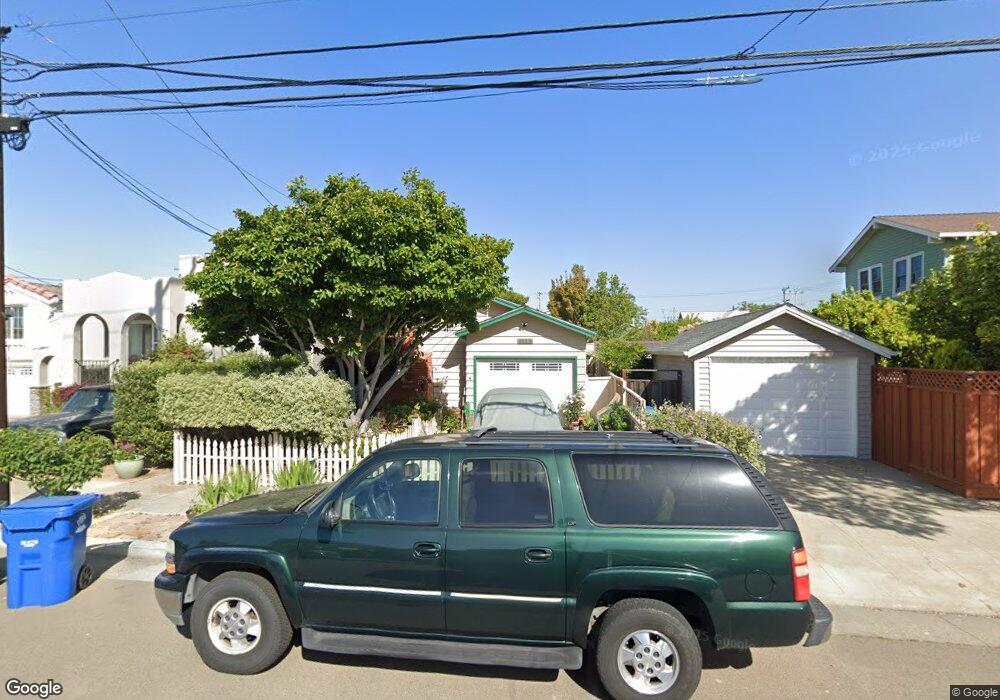
1135 Peach St Alameda, CA 94501
South Shore NeighborhoodEstimated Value: $1,018,428 - $1,361,000
3
Beds
1
Bath
1,236
Sq Ft
$955/Sq Ft
Est. Value
About This Home
This home is located at 1135 Peach St, Alameda, CA 94501 and is currently estimated at $1,180,857, approximately $955 per square foot. 1135 Peach St is a home located in Alameda County with nearby schools including Frank Otis Elementary School, Lincoln Middle School, and Alameda High School.
Ownership History
Date
Name
Owned For
Owner Type
Purchase Details
Closed on
Mar 22, 1996
Sold by
Burch Joseph Richard and Lena J Burch Trust Of 1991
Bought by
Ruckman Mary Wayne and Ruckman Karen R
Current Estimated Value
Home Financials for this Owner
Home Financials are based on the most recent Mortgage that was taken out on this home.
Original Mortgage
$203,000
Outstanding Balance
$7,925
Interest Rate
6.98%
Mortgage Type
VA
Estimated Equity
$1,172,932
Create a Home Valuation Report for This Property
The Home Valuation Report is an in-depth analysis detailing your home's value as well as a comparison with similar homes in the area
Home Values in the Area
Average Home Value in this Area
Purchase History
| Date | Buyer | Sale Price | Title Company |
|---|---|---|---|
| Ruckman Mary Wayne | $204,545 | First American Title Guarant |
Source: Public Records
Mortgage History
| Date | Status | Borrower | Loan Amount |
|---|---|---|---|
| Open | Ruckman Mary Wayne | $203,000 |
Source: Public Records
Tax History Compared to Growth
Tax History
| Year | Tax Paid | Tax Assessment Tax Assessment Total Assessment is a certain percentage of the fair market value that is determined by local assessors to be the total taxable value of land and additions on the property. | Land | Improvement |
|---|---|---|---|---|
| 2025 | $5,884 | $333,537 | $102,161 | $238,376 |
| 2024 | $5,884 | $326,860 | $100,158 | $233,702 |
| 2023 | $5,682 | $327,314 | $98,194 | $229,120 |
| 2022 | $5,562 | $313,898 | $96,269 | $224,629 |
| 2021 | $5,437 | $307,607 | $94,382 | $220,225 |
| 2020 | $5,373 | $311,381 | $93,414 | $217,967 |
| 2019 | $4,942 | $305,277 | $91,583 | $213,694 |
| 2018 | $4,826 | $299,293 | $89,788 | $209,505 |
| 2017 | $4,629 | $293,426 | $88,028 | $205,398 |
| 2016 | $4,618 | $287,674 | $86,302 | $201,372 |
| 2015 | $4,598 | $283,354 | $85,006 | $198,348 |
| 2014 | $4,413 | $277,805 | $83,341 | $194,464 |
Source: Public Records
Map
Nearby Homes
- 3208 Washington St
- 1259 Eastshore Dr
- 2839 Washington St
- 3171 Bayview Dr
- 3103 Central Ave
- 2829 Otis Dr
- 1238 Versailles Ave
- 3012 Bayview Dr
- 3246 Garfield Ave
- 975 Pearl St
- 2620 Encinal Ave
- 1210 Broadway Unit A
- 3114 Thompson Ave
- 3029 Thompson Ave
- 642 Centre Ct
- 641 Centre Ct
- 1024 Regent St
- 1100 Park Ave
- 2959 Sea View Pkwy
- 2431 Roosevelt Dr