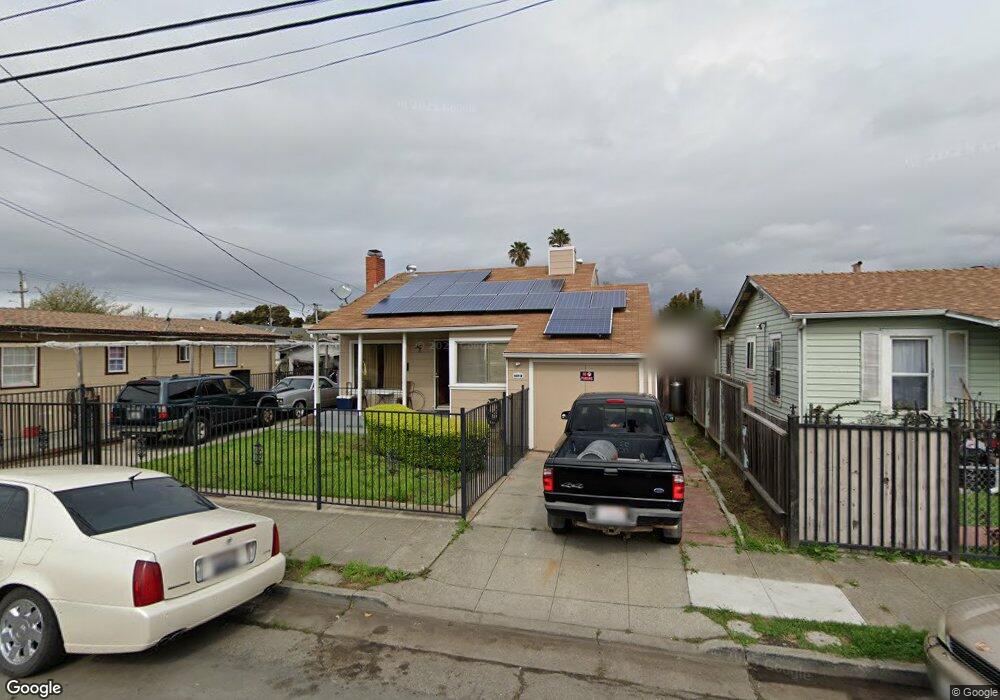
1137 76th Ave Oakland, CA 94621
Fitchburg NeighborhoodEstimated Value: $416,289 - $459,000
2
Beds
1
Bath
926
Sq Ft
$480/Sq Ft
Est. Value
About This Home
This home is located at 1137 76th Ave, Oakland, CA 94621 and is currently estimated at $444,572, approximately $480 per square foot. 1137 76th Ave is a home located in Alameda County with nearby schools including Futures & CUES at Lockwood, Greenleaf TK-8, and Coliseum College Prep Academy.
Ownership History
Date
Name
Owned For
Owner Type
Purchase Details
Closed on
Sep 18, 2024
Sold by
Allen Shannon
Bought by
Watson David C
Current Estimated Value
Home Financials for this Owner
Home Financials are based on the most recent Mortgage that was taken out on this home.
Original Mortgage
$190,000
Outstanding Balance
$187,753
Interest Rate
6.2%
Mortgage Type
New Conventional
Estimated Equity
$256,819
Create a Home Valuation Report for This Property
The Home Valuation Report is an in-depth analysis detailing your home's value as well as a comparison with similar homes in the area
Home Values in the Area
Average Home Value in this Area
Purchase History
| Date | Buyer | Sale Price | Title Company |
|---|---|---|---|
| Watson David C | -- | Pacific Coast Title |
Source: Public Records
Mortgage History
| Date | Status | Borrower | Loan Amount |
|---|---|---|---|
| Open | Watson David C | $190,000 |
Source: Public Records
Tax History Compared to Growth
Tax History
| Year | Tax Paid | Tax Assessment Tax Assessment Total Assessment is a certain percentage of the fair market value that is determined by local assessors to be the total taxable value of land and additions on the property. | Land | Improvement |
|---|---|---|---|---|
| 2025 | $3,397 | $357,140 | $114,444 | $249,696 |
| 2024 | $3,397 | $51,438 | $15,855 | $42,583 |
| 2023 | $2,906 | $57,292 | $15,544 | $41,748 |
| 2022 | $2,345 | $49,168 | $15,239 | $40,929 |
| 2021 | $2,077 | $48,068 | $14,941 | $40,127 |
| 2020 | $2,050 | $54,502 | $14,787 | $39,715 |
| 2019 | $1,869 | $53,434 | $14,497 | $38,937 |
| 2018 | $1,832 | $52,386 | $14,213 | $38,173 |
| 2017 | $1,723 | $51,359 | $13,934 | $37,425 |
| 2016 | $1,566 | $50,352 | $13,661 | $36,691 |
| 2015 | $1,552 | $49,596 | $13,456 | $36,140 |
| 2014 | $1,444 | $48,625 | $13,193 | $35,432 |
Source: Public Records
Map
Nearby Homes