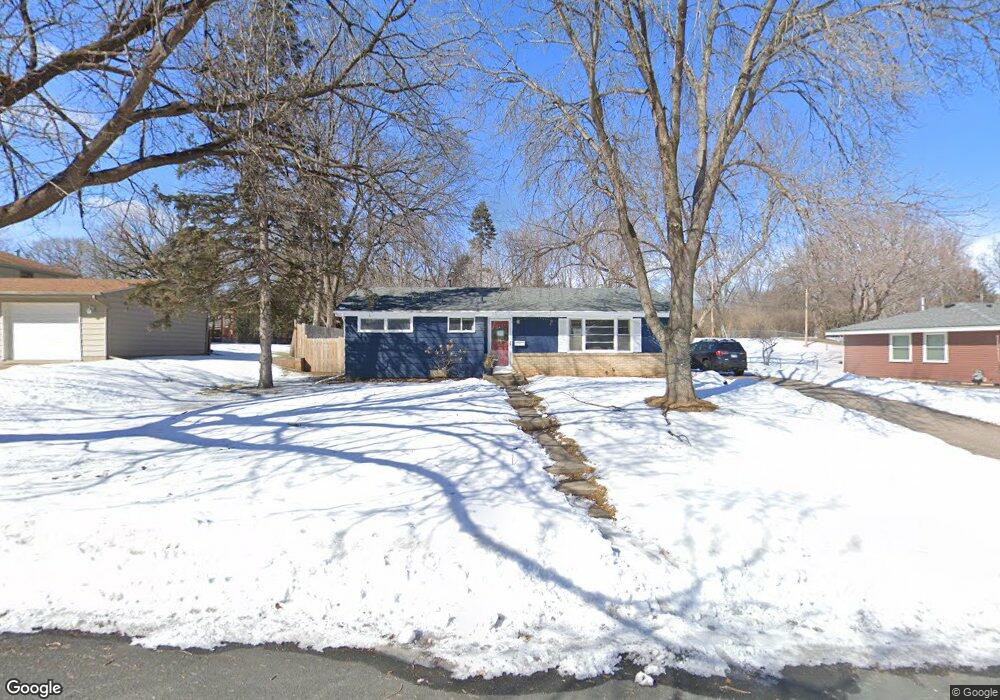
11424 Kell Rd Bloomington, MN 55437
West Bloomington NeighborhoodEstimated Value: $337,000 - $360,000
3
Beds
2
Baths
1,095
Sq Ft
$322/Sq Ft
Est. Value
About This Home
This home is located at 11424 Kell Rd, Bloomington, MN 55437 and is currently estimated at $352,061, approximately $321 per square foot. 11424 Kell Rd is a home located in Hennepin County with nearby schools including Westwood Elementary School, Oak Grove Middle School, and Jefferson Senior High School.
Ownership History
Date
Name
Owned For
Owner Type
Purchase Details
Closed on
Mar 1, 2021
Sold by
Thayer Lindsey Marie and Thayer Frank Cooley
Bought by
Thayer Lindsey Marie and Thayer Frank Cooley
Current Estimated Value
Home Financials for this Owner
Home Financials are based on the most recent Mortgage that was taken out on this home.
Original Mortgage
$222,400
Outstanding Balance
$199,366
Interest Rate
2.7%
Mortgage Type
New Conventional
Estimated Equity
$152,695
Purchase Details
Closed on
Jun 3, 2014
Sold by
Mortinson Kevin J and Mortinson Elizabeth A
Bought by
Mortinson Lindsey Marie
Home Financials for this Owner
Home Financials are based on the most recent Mortgage that was taken out on this home.
Original Mortgage
$160,000
Interest Rate
4.18%
Mortgage Type
New Conventional
Purchase Details
Closed on
Apr 9, 1997
Sold by
Zubert Peter C and Zubert Donna M
Bought by
Mortinson Kevin J and Mortinson Elizabeth A
Create a Home Valuation Report for This Property
The Home Valuation Report is an in-depth analysis detailing your home's value as well as a comparison with similar homes in the area
Home Values in the Area
Average Home Value in this Area
Purchase History
| Date | Buyer | Sale Price | Title Company |
|---|---|---|---|
| Thayer Lindsey Marie | -- | Knight Barry Ttl United Llc | |
| Mortinson Lindsey Marie | $200,000 | Executive Title | |
| Mortinson Kevin J | $106,900 | -- |
Source: Public Records
Mortgage History
| Date | Status | Borrower | Loan Amount |
|---|---|---|---|
| Open | Thayer Lindsey Marie | $222,400 | |
| Closed | Mortinson Lindsey Marie | $160,000 |
Source: Public Records
Tax History
| Year | Tax Paid | Tax Assessment Tax Assessment Total Assessment is a certain percentage of the fair market value that is determined by local assessors to be the total taxable value of land and additions on the property. | Land | Improvement |
|---|---|---|---|---|
| 2024 | $4,235 | $340,400 | $148,400 | $192,000 |
| 2023 | $4,178 | $352,000 | $160,000 | $192,000 |
| 2022 | $3,520 | $345,400 | $157,100 | $188,300 |
| 2021 | $3,331 | $284,900 | $133,100 | $151,800 |
| 2020 | $3,242 | $273,400 | $129,300 | $144,100 |
| 2019 | $2,875 | $260,300 | $129,300 | $131,000 |
| 2018 | $2,830 | $230,300 | $127,100 | $103,200 |
| 2017 | $2,624 | $209,100 | $114,100 | $95,000 |
| 2016 | $2,713 | $205,500 | $110,300 | $95,200 |
| 2015 | $2,619 | $192,700 | $107,000 | $85,700 |
| 2014 | -- | $178,100 | $103,800 | $74,300 |
Source: Public Records
Map
Nearby Homes
- 11014 Stanley Curve
- 11019 Stanley Rd
- 5100 W 110th St
- 11137 Trail West Rd
- 5008 W 108th St
- 11208 Vessey Cir
- 11313 Xavier Rd
- 11115 Vessey Cir
- 11428 Zion Cir
- 5101 Balmoral Ln
- 5141 Balmoral Ln Unit 3
- 10666 Utica Rd
- 10746 Toledo Ct
- 3708 W Old Shakopee Rd
- 5124 Heritage Hills Dr
- 10822 Xerxes Ave S
- 4001 Heritage Hills Dr Unit 304
- 4009 Heritage Hills Dr Unit 202
- 4009 Heritage Hills Dr Unit 108
- 6100 Auto Club Rd Unit 211
- 4532 Terracewood Dr
- 4540 Terracewood Dr
- 4697 Morris Ln
- 11408 Kell Rd
- 11433 Kell Rd
- 4524 Terracewood Dr
- 4689 Morris Ln
- 11400 Kell Rd
- 11417 Kell Rd
- 4541 Terracewood Dr
- 4533 Terracewood Dr
- 4516 Terracewood Dr
- 4600 Terracewood Dr
- 4681 Morris Ln
- 11348 Kell Rd
- 4601 Terracewood Dr
- 11427 Kell Cir
- 4525 Terracewood Dr
- 4517 Terracewood Dr
- 11419 Kell Cir
Your Personal Tour Guide
Ask me questions while you tour the home.