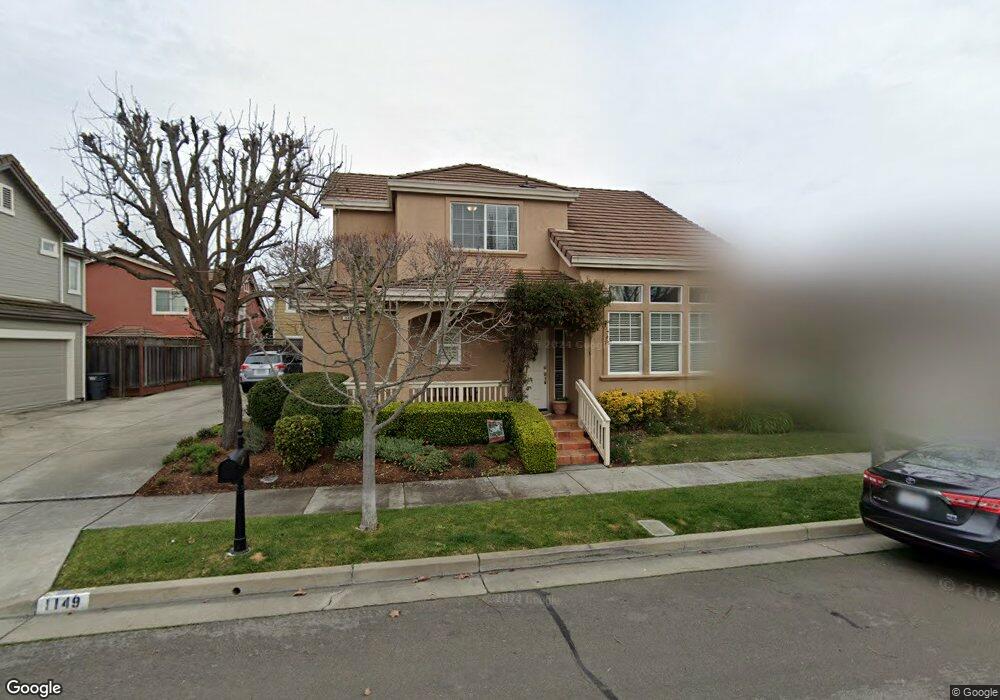
1149 River Pine Cir Petaluma, CA 94954
Adobe NeighborhoodEstimated Value: $864,119 - $1,006,000
3
Beds
3
Baths
1,805
Sq Ft
$519/Sq Ft
Est. Value
About This Home
This home is located at 1149 River Pine Cir, Petaluma, CA 94954 and is currently estimated at $937,280, approximately $519 per square foot. 1149 River Pine Cir is a home located in Sonoma County with nearby schools including La Tercera Elementary School, Kenilworth Junior High School, and Casa Grande High School.
Ownership History
Date
Name
Owned For
Owner Type
Purchase Details
Closed on
Oct 19, 2020
Sold by
Groat Gary and Groat Helen
Bought by
Groat Gary and Groat Helen
Current Estimated Value
Purchase Details
Closed on
Feb 24, 2003
Sold by
Hanley Lorrie
Bought by
Groat Gary and Groat Helen
Home Financials for this Owner
Home Financials are based on the most recent Mortgage that was taken out on this home.
Original Mortgage
$100,000
Outstanding Balance
$43,147
Interest Rate
5.93%
Estimated Equity
$894,133
Purchase Details
Closed on
Apr 27, 1998
Sold by
Mardell Llc
Bought by
Hanley Lorrie
Home Financials for this Owner
Home Financials are based on the most recent Mortgage that was taken out on this home.
Original Mortgage
$199,800
Interest Rate
7.06%
Create a Home Valuation Report for This Property
The Home Valuation Report is an in-depth analysis detailing your home's value as well as a comparison with similar homes in the area
Home Values in the Area
Average Home Value in this Area
Purchase History
| Date | Buyer | Sale Price | Title Company |
|---|---|---|---|
| Groat Gary | -- | None Available | |
| Groat Gary | $441,000 | North Bay Title Co | |
| Hanley Lorrie | $250,000 | First American Title |
Source: Public Records
Mortgage History
| Date | Status | Borrower | Loan Amount |
|---|---|---|---|
| Open | Groat Gary | $100,000 | |
| Previous Owner | Hanley Lorrie | $199,800 | |
| Closed | Groat Gary | $80,000 |
Source: Public Records
Tax History
| Year | Tax Paid | Tax Assessment Tax Assessment Total Assessment is a certain percentage of the fair market value that is determined by local assessors to be the total taxable value of land and additions on the property. | Land | Improvement |
|---|---|---|---|---|
| 2025 | $6,971 | $638,713 | $253,455 | $385,258 |
| 2024 | $6,971 | $626,190 | $248,486 | $377,704 |
| 2023 | $6,971 | $613,913 | $243,614 | $370,299 |
| 2022 | $6,807 | $601,877 | $238,838 | $363,039 |
| 2021 | $6,726 | $590,076 | $234,155 | $355,921 |
| 2020 | $6,772 | $584,027 | $231,755 | $352,272 |
| 2019 | $6,702 | $572,576 | $227,211 | $345,365 |
| 2018 | $6,506 | $561,350 | $222,756 | $338,594 |
| 2017 | $6,410 | $550,344 | $218,389 | $331,955 |
| 2016 | $6,215 | $539,554 | $214,107 | $325,447 |
| 2015 | $6,054 | $531,450 | $210,891 | $320,559 |
| 2014 | $5,580 | $485,000 | $192,000 | $293,000 |
Source: Public Records
Map
Nearby Homes
- 16 Arrowhead Ct
- 1043 Allen St
- 1212 Del Rancho Way
- 35 Princeville Ct
- 1097 Crinella Dr
- 2403 Marylyn Cir
- 2302 Marylyn Cir Unit 11
- 1619 Oneel Dr
- 815 Whitney Way
- 800 Mckillop Ct
- 1168 Wieling Way
- 1636 Caulfield Ln
- 1109 Saint Vincent Ct
- 1280 Saint Francis Dr
- 1622 Weaverly Dr
- 1313 Berrydale Dr
- 3571 Old Adobe Rd
- 843 Cedarwood Ln
- 4091 Lakeville Hwy
- 1713 Alhambra Ct
- 1145 River Pine Cir
- 1924 Fallbrook Ln
- 1153 River Pine Cir
- 1928 Fallbrook Ln
- 1920 Fallbrook Ln
- 1141 River Pine Cir
- 1916 Fallbrook Ln
- 1137 River Pine Cir
- 1925 Fallbrook Ln
- 1154 River Pine Cir
- 1158 River Pine Cir
- 1929 Fallbrook Ln
- 1912 Fallbrook Ln
- 1921 Fallbrook Ln
- 1162 River Pine Cir
- 1133 River Pine Cir
- 1166 River Pine Cir
- 1165 River Pine Cir
- 1908 Fallbrook Ln
- 1116 Garfield Dr
Your Personal Tour Guide
Ask me questions while you tour the home.