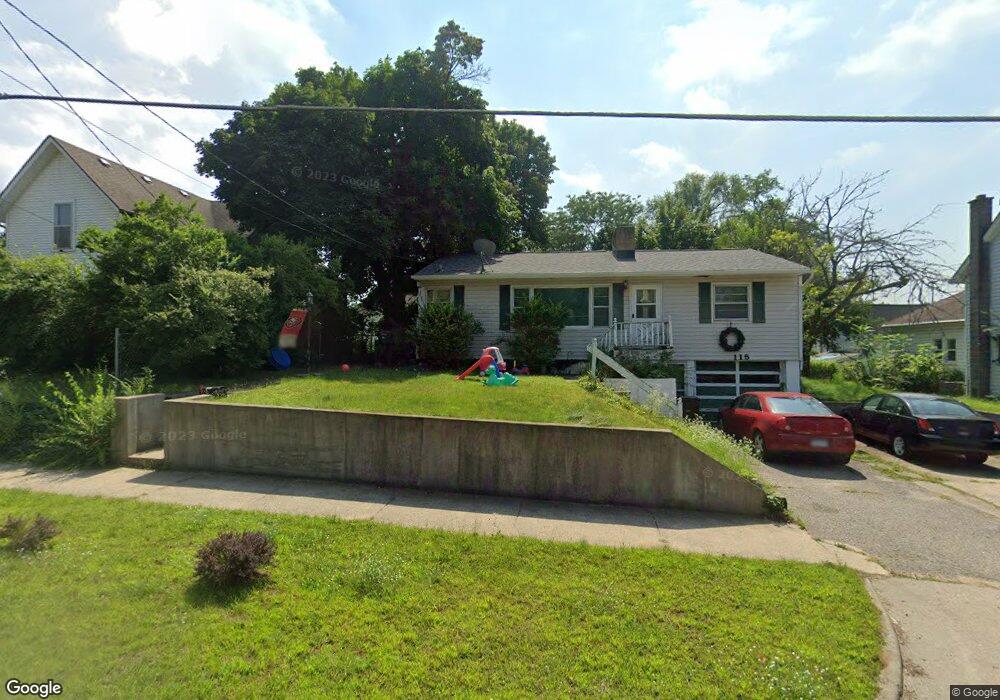
115 E Division St Belding, MI 48809
Estimated Value: $188,000 - $218,000
2
Beds
1
Bath
1,300
Sq Ft
$155/Sq Ft
Est. Value
About This Home
This home is located at 115 E Division St, Belding, MI 48809 and is currently estimated at $201,977, approximately $155 per square foot. 115 E Division St is a home located in Ionia County with nearby schools including Ellis Elementary School, Woodview Elementary School, and Belding Middle School.
Ownership History
Date
Name
Owned For
Owner Type
Purchase Details
Closed on
Dec 23, 2003
Sold by
Cooper John C and Cooper Leann K
Bought by
Bannister Lisa
Current Estimated Value
Home Financials for this Owner
Home Financials are based on the most recent Mortgage that was taken out on this home.
Original Mortgage
$93,080
Outstanding Balance
$43,222
Interest Rate
5.91%
Mortgage Type
Purchase Money Mortgage
Estimated Equity
$158,755
Create a Home Valuation Report for This Property
The Home Valuation Report is an in-depth analysis detailing your home's value as well as a comparison with similar homes in the area
Home Values in the Area
Average Home Value in this Area
Purchase History
| Date | Buyer | Sale Price | Title Company |
|---|---|---|---|
| Bannister Lisa | $94,150 | -- |
Source: Public Records
Mortgage History
| Date | Status | Borrower | Loan Amount |
|---|---|---|---|
| Open | Bannister Lisa | $93,080 |
Source: Public Records
Tax History
| Year | Tax Paid | Tax Assessment Tax Assessment Total Assessment is a certain percentage of the fair market value that is determined by local assessors to be the total taxable value of land and additions on the property. | Land | Improvement |
|---|---|---|---|---|
| 2025 | $1,945 | $96,200 | $12,300 | $83,900 |
| 2024 | $18 | $96,200 | $12,300 | $83,900 |
| 2023 | $1,748 | $70,600 | $11,300 | $59,300 |
| 2022 | $1,665 | $70,600 | $11,300 | $59,300 |
| 2021 | $1,728 | $59,400 | $7,300 | $52,100 |
| 2020 | $1,614 | $59,400 | $7,300 | $52,100 |
| 2019 | $1,511 | $54,500 | $7,000 | $47,500 |
| 2018 | $1,691 | $48,600 | $8,000 | $40,600 |
| 2017 | $1,524 | $48,600 | $8,000 | $40,600 |
| 2016 | $1,511 | $40,900 | $5,000 | $35,900 |
| 2015 | -- | $40,900 | $5,000 | $35,900 |
| 2014 | $1,700 | $38,500 | $4,800 | $33,700 |
Source: Public Records
Map
Nearby Homes
- 107 W Center St
- 721 Pearl St
- 616 S Broas St
- 542 Ionia St
- 516 S Front St
- 163 S York St
- 753 W State St
- 632 Edgewood St
- 208 Leonard St
- 216 Leonard St
- 415 N State Rd
- 6961 Riverwood Dr
- 749 Pine Ridge Dr
- 129 Midway St
- 9263 W Belding Rd
- 2160 W Ellis Parcel 6
- 2160 W Ellis Parcel 5
- 2160 W Ellis Parcel 2
- 2160 W Ellis Parcel 3
- 2160 W Ellis Parcel 4
- 107 E Division St
- 603 Alderman St
- 613 Alderman St
- 103 E Division St
- 521 Alderman St
- 614 S Bridge St
- 108 E Ann St
- 520 S Bridge St
- 116 E Ann St
- 203 E Division St
- 621 Alderman St
- 515 Alderman St
- 622 S Bridge St
- 612 Alderman St
- 516 S Bridge St
- 616 Alderman St
- 522 Alderman St
- 603 S Bridge St
- 609 S Bridge St
- 508 S Bridge St
Your Personal Tour Guide
Ask me questions while you tour the home.