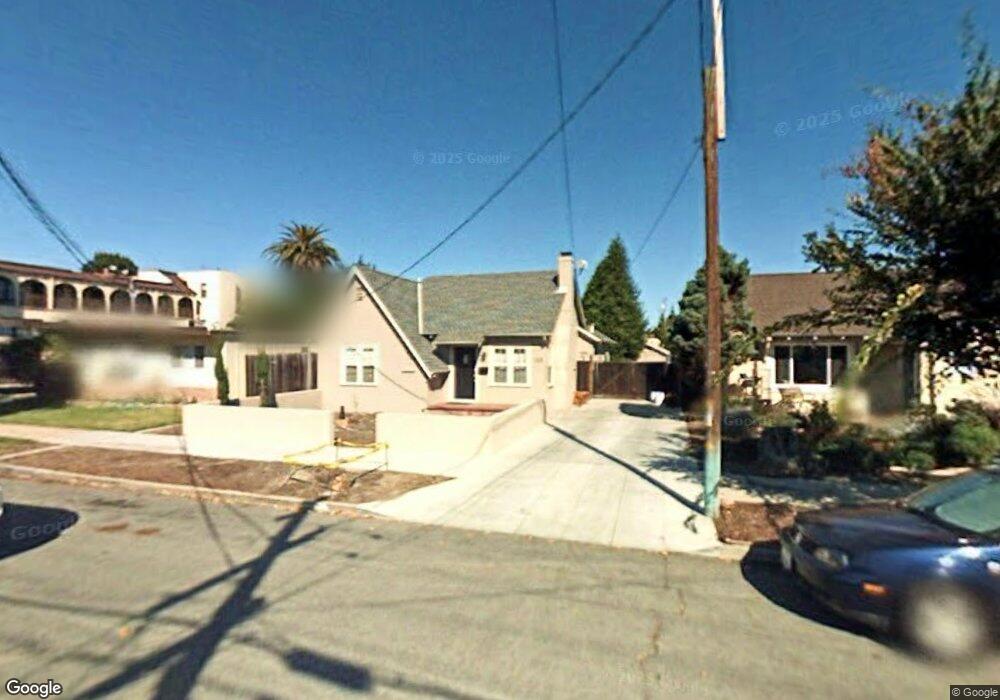
115 Pine St Salinas, CA 93901
South Salinas NeighborhoodEstimated Value: $602,894 - $700,000
2
Beds
1
Bath
1,013
Sq Ft
$643/Sq Ft
Est. Value
About This Home
This home is located at 115 Pine St, Salinas, CA 93901 and is currently estimated at $651,224, approximately $642 per square foot. 115 Pine St is a home located in Monterey County with nearby schools including Lincoln Elementary School, Monterey Park Elementary School, and Mission Park Elementary School.
Ownership History
Date
Name
Owned For
Owner Type
Purchase Details
Closed on
May 31, 2017
Sold by
Harris Frederick J
Bought by
Harris Frederick J and The Fj Harris Trust
Current Estimated Value
Purchase Details
Closed on
Mar 25, 2010
Sold by
Harris Fred and Harris Diane
Bought by
Harris Frederick J
Home Financials for this Owner
Home Financials are based on the most recent Mortgage that was taken out on this home.
Original Mortgage
$42,000
Interest Rate
4.88%
Mortgage Type
New Conventional
Purchase Details
Closed on
Jan 21, 2009
Sold by
Harris Diane K
Bought by
Harris Diane K
Purchase Details
Closed on
May 12, 2005
Sold by
Harris Diane K
Bought by
Harris Fred and Harris Diane
Create a Home Valuation Report for This Property
The Home Valuation Report is an in-depth analysis detailing your home's value as well as a comparison with similar homes in the area
Home Values in the Area
Average Home Value in this Area
Purchase History
| Date | Buyer | Sale Price | Title Company |
|---|---|---|---|
| Harris Frederick J | -- | None Available | |
| Harris Frederick J | -- | Old Republic Title Company | |
| Harris Diane K | -- | None Available | |
| Harris Fred | -- | -- |
Source: Public Records
Mortgage History
| Date | Status | Borrower | Loan Amount |
|---|---|---|---|
| Closed | Harris Frederick J | $42,000 |
Source: Public Records
Tax History
| Year | Tax Paid | Tax Assessment Tax Assessment Total Assessment is a certain percentage of the fair market value that is determined by local assessors to be the total taxable value of land and additions on the property. | Land | Improvement |
|---|---|---|---|---|
| 2025 | $2,234 | $199,536 | $71,078 | $128,458 |
| 2024 | $2,234 | $195,625 | $69,685 | $125,940 |
| 2023 | $2,158 | $191,790 | $68,319 | $123,471 |
| 2022 | $2,074 | $188,030 | $66,980 | $121,050 |
| 2021 | $2,068 | $184,344 | $65,667 | $118,677 |
| 2020 | $2,345 | $182,455 | $64,994 | $117,461 |
| 2019 | $1,996 | $178,878 | $63,720 | $115,158 |
| 2018 | $1,969 | $175,371 | $62,471 | $112,900 |
| 2017 | $1,971 | $171,934 | $61,247 | $110,687 |
| 2016 | $1,972 | $168,564 | $60,047 | $108,517 |
| 2015 | $1,989 | $166,033 | $59,146 | $106,887 |
| 2014 | $1,857 | $162,782 | $57,988 | $104,794 |
Source: Public Records
Map
Nearby Homes
- 202 Pine St
- 813 Pajaro St
- 116 Oak St
- 123 Chestnut St
- 22 Willow St
- 1 Santa Lucia Ave
- 321 Hawthorne St
- 54 Katherine Ave
- 50 Katherine Ave
- 333 Hawthorne St
- 14 San Juan Dr
- 612 Alameda Ave
- 1055 Padre Dr Unit 2
- 1051 Padre Dr Unit 7
- 323 San Miguel Ave
- 1067 Padre Dr Unit 2
- 1067 Padre Dr Unit 1
- 1052 Padre Dr Unit 3
- 1056 Padre Dr Unit 4
- 1051 Riker St Unit 7
Your Personal Tour Guide
Ask me questions while you tour the home.