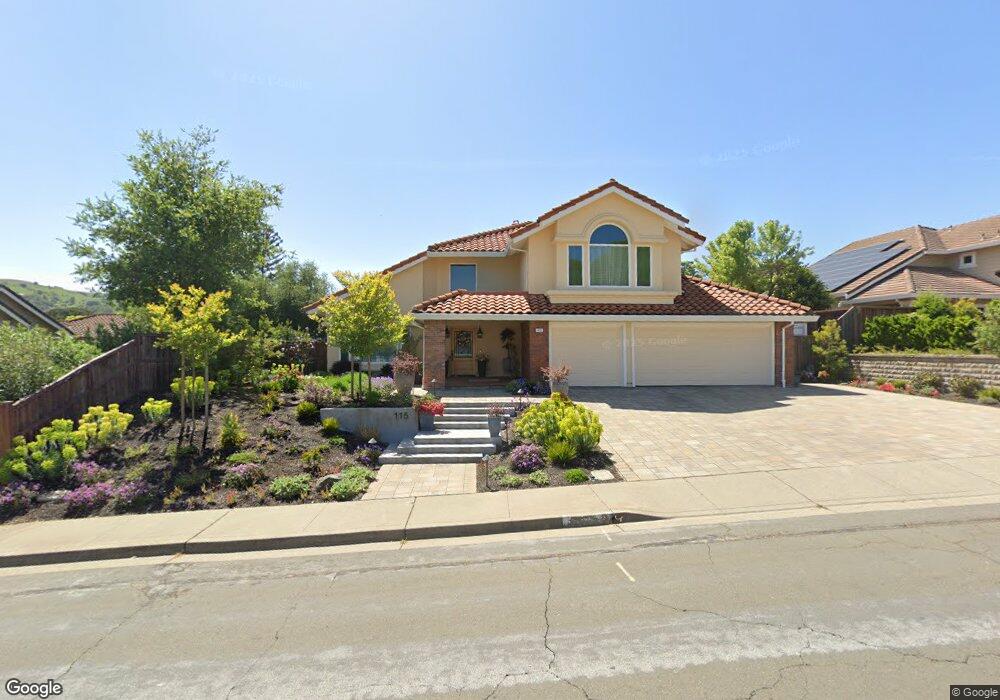
115 Shepard St Hercules, CA 94547
Estimated Value: $919,536 - $1,010,000
5
Beds
3
Baths
2,611
Sq Ft
$371/Sq Ft
Est. Value
About This Home
This home is located at 115 Shepard St, Hercules, CA 94547 and is currently estimated at $969,384, approximately $371 per square foot. 115 Shepard St is a home located in Contra Costa County with nearby schools including Lupine Hills Elementary School, Hercules Middle School, and Hercules High School.
Ownership History
Date
Name
Owned For
Owner Type
Purchase Details
Closed on
Apr 27, 2022
Sold by
Lackner Marc A and Lackner Morena
Bought by
Lackner Family Trust
Current Estimated Value
Home Financials for this Owner
Home Financials are based on the most recent Mortgage that was taken out on this home.
Original Mortgage
$599,000
Outstanding Balance
$562,676
Interest Rate
4.72%
Mortgage Type
New Conventional
Estimated Equity
$406,708
Purchase Details
Closed on
Sep 28, 2017
Sold by
Lackner Morena and Diaz Morena
Bought by
Lackner Marc A and Lackner Morena
Purchase Details
Closed on
Mar 13, 2008
Sold by
Diaz Morena and Diaz Morena B
Bought by
Diaz Morena
Home Financials for this Owner
Home Financials are based on the most recent Mortgage that was taken out on this home.
Original Mortgage
$487,500
Interest Rate
7.54%
Mortgage Type
Stand Alone Refi Refinance Of Original Loan
Purchase Details
Closed on
Dec 11, 2002
Sold by
Diaz Morena B
Bought by
Diaz Morena B and Tenuto Michael
Home Financials for this Owner
Home Financials are based on the most recent Mortgage that was taken out on this home.
Original Mortgage
$290,000
Interest Rate
6.06%
Mortgage Type
Purchase Money Mortgage
Purchase Details
Closed on
May 14, 1996
Sold by
Diaz Arthur
Bought by
Diaz Morena B
Purchase Details
Closed on
Oct 26, 1995
Sold by
Diaz Arthur
Bought by
Diaz Morena B
Create a Home Valuation Report for This Property
The Home Valuation Report is an in-depth analysis detailing your home's value as well as a comparison with similar homes in the area
Home Values in the Area
Average Home Value in this Area
Purchase History
| Date | Buyer | Sale Price | Title Company |
|---|---|---|---|
| Lackner Family Trust | -- | Amrock | |
| Lackner Marc A | -- | Amrock | |
| Lackner Marc A | -- | None Available | |
| Diaz Morena | -- | Chicago Title Company | |
| Diaz Morena B | -- | Fidelity National Title | |
| Diaz Morena B | -- | -- | |
| Diaz Morena B | -- | Frontier Title Company |
Source: Public Records
Mortgage History
| Date | Status | Borrower | Loan Amount |
|---|---|---|---|
| Open | Lackner Marc A | $599,000 | |
| Previous Owner | Diaz Morena | $487,500 | |
| Previous Owner | Diaz Morena B | $290,000 |
Source: Public Records
Tax History
| Year | Tax Paid | Tax Assessment Tax Assessment Total Assessment is a certain percentage of the fair market value that is determined by local assessors to be the total taxable value of land and additions on the property. | Land | Improvement |
|---|---|---|---|---|
| 2025 | $8,527 | $526,084 | $114,826 | $411,258 |
| 2024 | $8,040 | $515,770 | $112,575 | $403,195 |
| 2023 | $8,040 | $505,658 | $110,368 | $395,290 |
| 2022 | $7,964 | $495,744 | $108,204 | $387,540 |
| 2021 | $7,324 | $432,672 | $106,083 | $326,589 |
| 2019 | $6,604 | $391,701 | $102,938 | $288,763 |
| 2018 | $6,367 | $384,021 | $100,920 | $283,101 |
| 2017 | $6,186 | $376,492 | $98,942 | $277,550 |
| 2016 | $6,025 | $369,110 | $97,002 | $272,108 |
| 2015 | $6,036 | $363,566 | $95,545 | $268,021 |
| 2014 | $6,017 | $356,445 | $93,674 | $262,771 |
Source: Public Records
Map
Nearby Homes
- 161 Seaway Ct
- 248 Carson St
- 301 Boatswain Ct
- 103 Tuscany Ct
- 139 Tuscany Ct Unit 139
- 256 Napoli Ct Unit 256
- 147 Vierra Way
- 134 Caprice Cir
- 720 Seacliff Ct
- 2646 Doidge Ave
- 2555 Arroyo Ave
- 2620 Shady Draw
- 405 Weymouth
- 938 Sandy Cove Dr
- 120 Bonita Ct
- 704 Windsor Unit 704
- 922 Coral Dr
- 802 Dover
- 1723 Pheasant Dr
- 801 Dover
- 121 Shepard St
- 191 Grissom Ct
- 179 Grissom Ct
- 226 Beechnut Dr
- 127 Shepard St
- 112 Shepard St
- 232 Beechnut Dr
- 118 Shepard St
- 220 Beechnut Dr
- 106 Shepard St
- 124 Shepard St
- 133 Shepard St
- 188 Grissom Ct
- 130 Shepard St
- 182 Grissom Ct
- 214 Beechnut Dr
- 238 Beechnut Dr
- 209 Grissom St
- 176 Grissom Ct
- 139 Shepard St
Your Personal Tour Guide
Ask me questions while you tour the home.