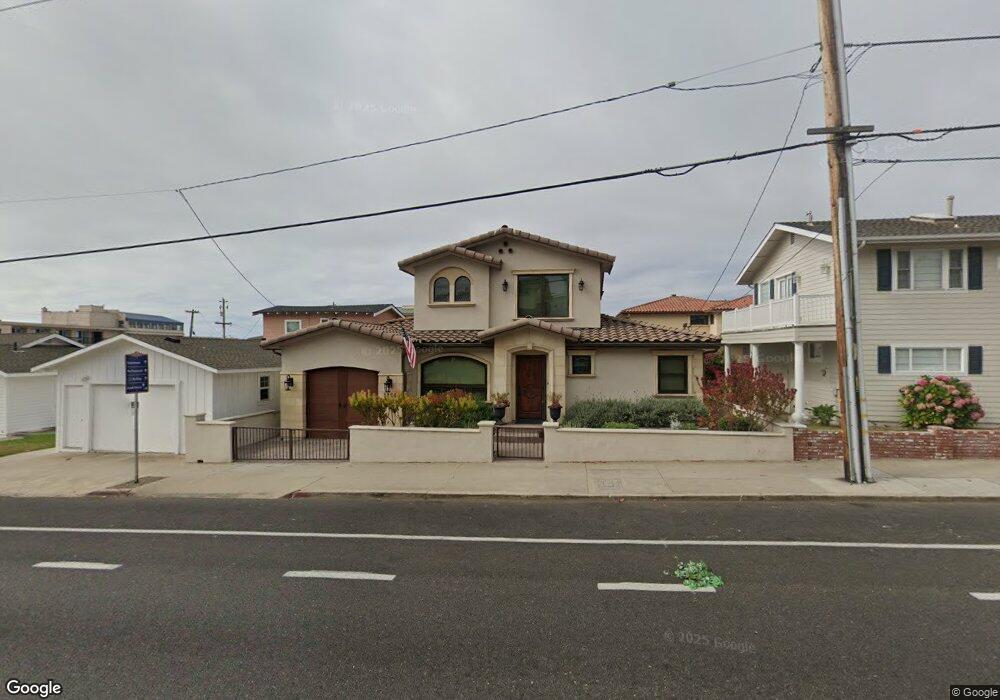
1151 Dolliver St Pismo Beach, CA 93449
Estimated Value: $1,283,000 - $1,666,000
4
Beds
3
Baths
2,042
Sq Ft
$702/Sq Ft
Est. Value
About This Home
This home is located at 1151 Dolliver St, Pismo Beach, CA 93449 and is currently estimated at $1,433,172, approximately $701 per square foot. 1151 Dolliver St is a home located in San Luis Obispo County with nearby schools including Judkins Middle School, Arroyo Grande High School, and Dandy Lion Montessori School.
Ownership History
Date
Name
Owned For
Owner Type
Purchase Details
Closed on
Dec 23, 2020
Sold by
Schott Erica L
Bought by
Schott Russell J and Schott Pamla J
Current Estimated Value
Purchase Details
Closed on
Jul 29, 2014
Sold by
Schott Russell J and Schott Pamla J
Bought by
Schott Family Revocable Trust
Purchase Details
Closed on
Oct 5, 2012
Sold by
Schott Erica Lynn and Estate Of Lou Amelia Schott
Bought by
Schott Russell J and Schott Pamla J
Home Financials for this Owner
Home Financials are based on the most recent Mortgage that was taken out on this home.
Original Mortgage
$360,000
Interest Rate
3.35%
Mortgage Type
New Conventional
Purchase Details
Closed on
Jan 18, 2007
Sold by
Fernandes Johnny L and Fernandes Nivia Marie
Bought by
Fernandes Johnny L and Fernandes Nivia Marie
Create a Home Valuation Report for This Property
The Home Valuation Report is an in-depth analysis detailing your home's value as well as a comparison with similar homes in the area
Home Values in the Area
Average Home Value in this Area
Purchase History
| Date | Buyer | Sale Price | Title Company |
|---|---|---|---|
| Schott Russell J | $100,000 | None Available | |
| Schott Family Revocable Trust | -- | None Available | |
| Schott Russell J | -- | Fidelity Title Company | |
| Schott Russell J | $450,000 | Multiple | |
| Fernandes Johnny L | -- | None Available | |
| Fernandes Johnny L | -- | None Available |
Source: Public Records
Mortgage History
| Date | Status | Borrower | Loan Amount |
|---|---|---|---|
| Previous Owner | Schott Russell J | $360,000 |
Source: Public Records
Tax History Compared to Growth
Tax History
| Year | Tax Paid | Tax Assessment Tax Assessment Total Assessment is a certain percentage of the fair market value that is determined by local assessors to be the total taxable value of land and additions on the property. | Land | Improvement |
|---|---|---|---|---|
| 2025 | $9,719 | $927,707 | $472,078 | $455,629 |
| 2024 | $9,606 | $909,518 | $462,822 | $446,696 |
| 2023 | $9,606 | $891,686 | $453,748 | $437,938 |
| 2022 | $9,459 | $874,202 | $444,851 | $429,351 |
| 2021 | $9,263 | $841,042 | $416,600 | $424,442 |
| 2020 | $9,156 | $832,419 | $412,329 | $420,090 |
| 2019 | $9,089 | $816,098 | $404,245 | $411,853 |
| 2018 | $6,916 | $614,097 | $396,319 | $217,778 |
| 2017 | $6,220 | $549,959 | $388,549 | $161,410 |
| 2016 | $5,797 | $531,520 | $380,931 | $150,589 |
| 2015 | $5,354 | $489,556 | $375,210 | $114,346 |
| 2014 | $4,869 | $452,043 | $351,589 | $100,454 |
Source: Public Records
Map
Nearby Homes
- 1020 Cypress St Unit 342 & 344
- 198 Main St Unit 8
- 198 Main St Unit 12
- 198 Main St Unit 205
- 160 Hinds Ave Unit 202
- 480 Hinds Ave
- 357 Stimson Ave
- 355 Ocean View Ave Unit 2
- 428 Stimson Ave
- 172 Ocean View Ave
- 951 Fresno St
- 150 Park Ave
- 351 Selma St
- 841 Visalia St
- 991 Visalia St
- 780 Tulare St
- 140 S Dolliver St Unit 149
- 140 S Dolliver St Unit 144
- 1009 Price Canyon Rd
- 175 Clydell Ct
- 1191 Dolliver St
- 288 San Luis Ave
- 286 San Luis Ave
- 287 Wadsworth Ave
- 285 Wadsworth Ave
- 250 San Luis Ave
- 1190 Dolliver St
- 275 Wadsworth Ave
- 1120 Dolliver St
- 1150 Dolliver St
- 1130 Dolliver St
- 1140 Dolliver St
- 248 San Luis Ave
- 1110 Dolliver St
- 269 Wadsworth Ave
- 1160 Dolliver St
- 271 Wadsworth Ave
- 273 Wadsworth Ave
- 285 San Luis Ave
- 322 San Luis Ave