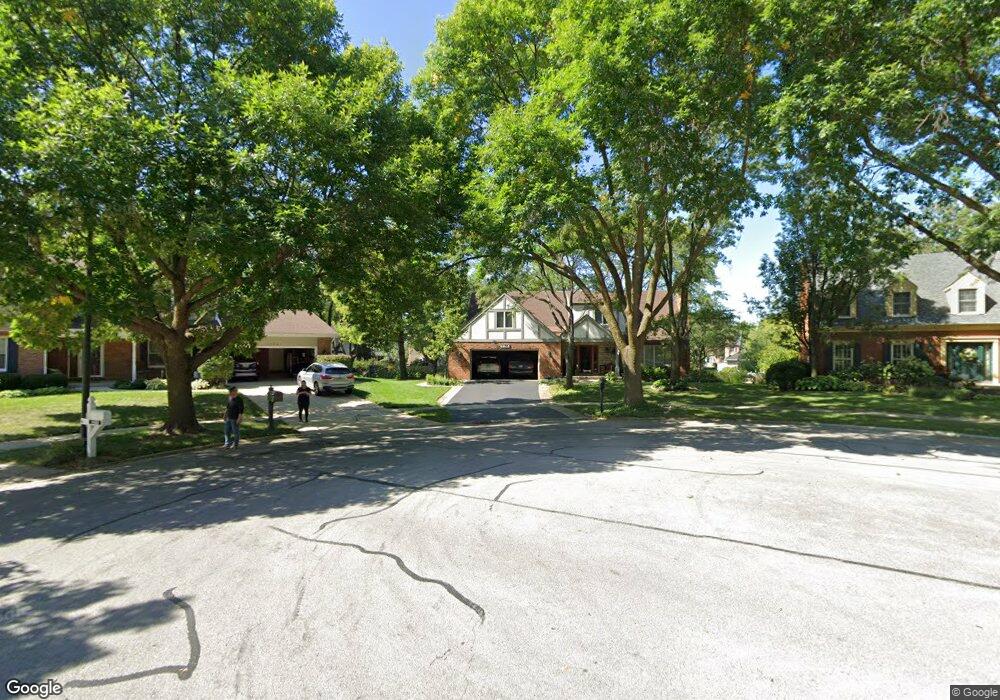
1158 Banyon Ct Naperville, IL 60540
Watts NeighborhoodEstimated Value: $740,000 - $836,000
4
Beds
3
Baths
3,206
Sq Ft
$243/Sq Ft
Est. Value
About This Home
This home is located at 1158 Banyon Ct, Naperville, IL 60540 and is currently estimated at $777,936, approximately $242 per square foot. 1158 Banyon Ct is a home located in DuPage County with nearby schools including May Watts Elementary School, Charlestown Middle School, and Thayer J. Hill Middle School.
Ownership History
Date
Name
Owned For
Owner Type
Purchase Details
Closed on
Oct 20, 2009
Sold by
Sanders Bruce Z and Sanders Martha H
Bought by
Declarat Sanders Martha H and Martha H Sanders 1998 Declaration Of Tru
Current Estimated Value
Purchase Details
Closed on
Jul 9, 2009
Sold by
Sanders Martha H and The Martha H Sanders 1998 Decl
Bought by
Sanders Bruce Z and Sanders Martha H
Home Financials for this Owner
Home Financials are based on the most recent Mortgage that was taken out on this home.
Original Mortgage
$364,000
Outstanding Balance
$241,284
Interest Rate
5.62%
Mortgage Type
Stand Alone Refi Refinance Of Original Loan
Estimated Equity
$536,652
Purchase Details
Closed on
Aug 25, 2006
Sold by
Sanders Bruce Z
Bought by
Sanders Martha H and The Martha H Sanders 1998 Declaration Tr
Create a Home Valuation Report for This Property
The Home Valuation Report is an in-depth analysis detailing your home's value as well as a comparison with similar homes in the area
Home Values in the Area
Average Home Value in this Area
Purchase History
| Date | Buyer | Sale Price | Title Company |
|---|---|---|---|
| Declarat Sanders Martha H | -- | None Available | |
| Sanders Bruce Z | -- | Source One Title | |
| Sanders Martha H | -- | First American Title Ins Co |
Source: Public Records
Mortgage History
| Date | Status | Borrower | Loan Amount |
|---|---|---|---|
| Open | Sanders Bruce Z | $364,000 |
Source: Public Records
Tax History Compared to Growth
Tax History
| Year | Tax Paid | Tax Assessment Tax Assessment Total Assessment is a certain percentage of the fair market value that is determined by local assessors to be the total taxable value of land and additions on the property. | Land | Improvement |
|---|---|---|---|---|
| 2024 | $13,274 | $228,667 | $56,546 | $172,121 |
| 2023 | $12,668 | $205,470 | $50,810 | $154,660 |
| 2022 | $11,915 | $185,340 | $47,870 | $137,470 |
| 2021 | $11,529 | $178,720 | $46,160 | $132,560 |
| 2020 | $11,513 | $178,720 | $46,160 | $132,560 |
| 2019 | $11,046 | $169,980 | $43,900 | $126,080 |
| 2018 | $11,131 | $168,250 | $41,490 | $126,760 |
| 2017 | $10,815 | $162,540 | $40,080 | $122,460 |
| 2016 | $10,606 | $155,980 | $38,460 | $117,520 |
| 2015 | $10,491 | $148,100 | $36,520 | $111,580 |
| 2014 | $10,272 | $140,590 | $34,390 | $106,200 |
| 2013 | $10,252 | $141,570 | $34,630 | $106,940 |
Source: Public Records
Map
Nearby Homes
- 1114 Tennyson Ln
- 1262 Rhodes Ln Unit 2701
- 7S410 Arbor Dr
- 1208 Tennyson Ln
- 1259 Natchez Trace Cir
- 1033 Emerald Dr
- 1217 Evergreen Ave
- 316 Hemlock Ln
- 319 Claremont Ct
- 845 Tulip Ln
- 480 Village Green Rd
- 856 Cardiff Rd
- 479 River Bend Rd Unit 111
- 225 Elmwood Dr
- 417 River Bluff Cir
- 132 Robin Hill Dr
- 891 Lowell Ln
- 511 Aurora Ave Unit 108
- 509 Aurora Ave Unit 209
- 1099 W Jefferson Ave
- 1162 Banyon Ct
- 1154 Banyon Ct
- 836 Buttonwood Cir
- 832 Buttonwood Cir
- 840 Buttonwood Cir
- 846 Buttonwood Cir
- 1153 Banyon Ct
- 828 Buttonwood Cir
- 1166 Banyon Ct
- 852 Buttonwood Cir
- 1157 Banyon Ct
- 860 Buttonwood Cir
- 824 Buttonwood Cir
- 1161 Banyon Ct
- 866 Buttonwood Cir
- 872 Buttonwood Cir
- 1174 Banyon Ct
- 1165 Banyon Ct
- 833 Buttonwood Cir
- 837 Buttonwood Cir