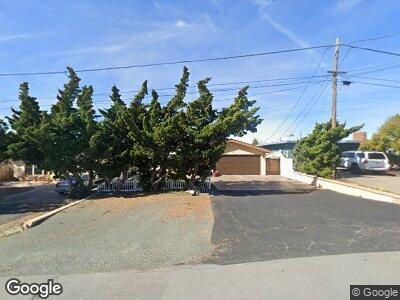
1159 3rd St Los Osos, CA 93402
Los Osos NeighborhoodEstimated Value: $969,000 - $1,345,000
3
Beds
2
Baths
2,000
Sq Ft
$576/Sq Ft
Est. Value
About This Home
This home is located at 1159 3rd St, Los Osos, CA 93402 and is currently estimated at $1,152,477, approximately $576 per square foot. 1159 3rd St is a home located in San Luis Obispo County with nearby schools including Baywood Elementary School, Los Osos Middle School, and Morro Bay High School.
Ownership History
Date
Name
Owned For
Owner Type
Purchase Details
Closed on
Mar 23, 2007
Sold by
Kridi Samer G
Bought by
Kridi Samer G and Akarri Eva
Current Estimated Value
Purchase Details
Closed on
Jun 23, 2005
Sold by
Peters Anthony James
Bought by
Kridi Samer G
Home Financials for this Owner
Home Financials are based on the most recent Mortgage that was taken out on this home.
Original Mortgage
$65,900
Interest Rate
5.65%
Mortgage Type
Credit Line Revolving
Purchase Details
Closed on
Jun 16, 2005
Sold by
Akarri Eva
Bought by
Kridi Samer G
Home Financials for this Owner
Home Financials are based on the most recent Mortgage that was taken out on this home.
Original Mortgage
$65,900
Interest Rate
5.65%
Mortgage Type
Credit Line Revolving
Purchase Details
Closed on
Feb 19, 2003
Sold by
Peters Anthony
Bought by
Peters Anthony James
Create a Home Valuation Report for This Property
The Home Valuation Report is an in-depth analysis detailing your home's value as well as a comparison with similar homes in the area
Home Values in the Area
Average Home Value in this Area
Purchase History
| Date | Buyer | Sale Price | Title Company |
|---|---|---|---|
| Kridi Samer G | -- | None Available | |
| Kridi Samer G | $659,000 | First American Title Co | |
| Kridi Samer G | -- | First American Title Co | |
| Peters Anthony James | -- | -- |
Source: Public Records
Mortgage History
| Date | Status | Borrower | Loan Amount |
|---|---|---|---|
| Open | Kridi Samer Georges | $700,000 | |
| Closed | Kridi Samer G | $407,000 | |
| Closed | Kridi Samer G | $150,000 | |
| Closed | Kridi Samer G | $440,000 | |
| Closed | Kridi Smaer G | $453,000 | |
| Closed | Kridi Samer G | $507,500 | |
| Closed | Kridi Samer G | $30,000 | |
| Closed | Kridi Samer G | $572,000 | |
| Closed | Kridi Samer G | $65,900 | |
| Closed | Kridi Samer G | $527,200 | |
| Closed | Kridi Samer G | $65,900 |
Source: Public Records
Tax History Compared to Growth
Tax History
| Year | Tax Paid | Tax Assessment Tax Assessment Total Assessment is a certain percentage of the fair market value that is determined by local assessors to be the total taxable value of land and additions on the property. | Land | Improvement |
|---|---|---|---|---|
| 2024 | $12,508 | $900,558 | $341,637 | $558,921 |
| 2023 | $12,508 | $882,901 | $334,939 | $547,962 |
| 2022 | $12,105 | $865,590 | $328,372 | $537,218 |
| 2021 | $10,057 | $686,000 | $260,000 | $426,000 |
| 2020 | $9,566 | $657,000 | $250,000 | $407,000 |
| 2019 | $9,490 | $657,000 | $250,000 | $407,000 |
| 2018 | $9,742 | $657,000 | $250,000 | $407,000 |
| 2017 | $9,347 | $634,000 | $240,000 | $394,000 |
| 2016 | $7,137 | $575,000 | $240,000 | $335,000 |
| 2015 | $6,117 | $480,000 | $180,000 | $300,000 |
| 2014 | $5,403 | $442,000 | $170,000 | $272,000 |
Source: Public Records
Map
Nearby Homes
- 670 Santa Lucia Ave
- 1196 1st St
- 771 Santa Ysabel
- 1184 1st St
- 1107 Pasadena Dr
- 0 Pasadena Dr Unit 18798331
- 0 Pasadena Dr Unit 224059829
- 1291 Pasadena Dr
- 1228 7th St
- 1415 4th St
- 870 El Moro Ave
- 1276 8th St
- 1711 5th St
- 1412 5th St
- 1420 5th St
- 1190 11th St
- 1531 7th St
- 1564 6th St
- 1527 11th St
- 1429 14th St