116 E Main St Lebanon, OH 45036
Estimated Value: $281,000 - $366,507
3
Beds
3
Baths
3,203
Sq Ft
$101/Sq Ft
Est. Value
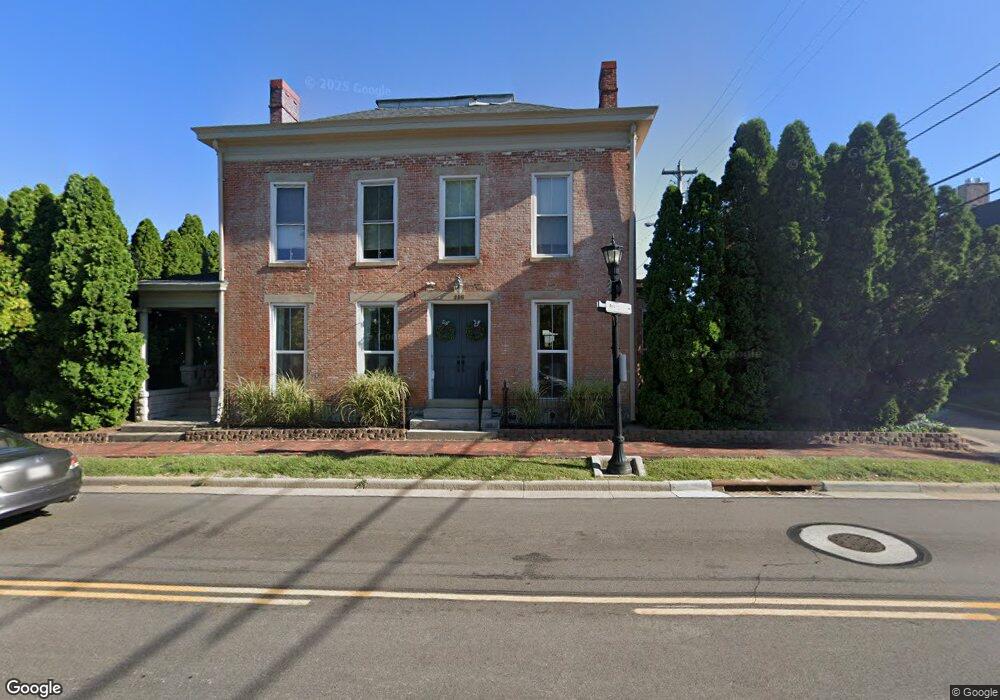
About This Home
This home is located at 116 E Main St, Lebanon, OH 45036 and is currently estimated at $322,127, approximately $100 per square foot. 116 E Main St is a home located in Warren County with nearby schools including Bowman Primary School, Berry Intermediate School, and Donovan Elementary School.
Ownership History
Date
Name
Owned For
Owner Type
Purchase Details
Closed on
Feb 2, 2023
Sold by
Pilot International Llc
Bought by
City Of Lebanon Ohio
Current Estimated Value
Purchase Details
Closed on
Apr 10, 2014
Sold by
Hall G Sue and 1St National Bank
Bought by
Pilot International Llc
Purchase Details
Closed on
Feb 1, 1995
Sold by
Keily Mark
Bought by
Hall Glenda S
Home Financials for this Owner
Home Financials are based on the most recent Mortgage that was taken out on this home.
Original Mortgage
$72,000
Interest Rate
9.24%
Mortgage Type
New Conventional
Purchase Details
Closed on
Mar 2, 1989
Sold by
Kearin Susan and Kearin Susan
Bought by
Keily and Keily Mark A
Purchase Details
Closed on
Oct 17, 1986
Sold by
Kearin Martin Anthony and Martin Anthony
Bought by
Kearin and Kearin Susan
Purchase Details
Closed on
Aug 1, 1986
Sold by
Sortor Harold K and Sortor Harold K
Bought by
Kearin and Martin Anthony
Create a Home Valuation Report for This Property
The Home Valuation Report is an in-depth analysis detailing your home's value as well as a comparison with similar homes in the area
Home Values in the Area
Average Home Value in this Area
Purchase History
| Date | Buyer | Sale Price | Title Company |
|---|---|---|---|
| City Of Lebanon Ohio | -- | None Listed On Document | |
| Pilot International Llc | $86,000 | None Available | |
| Hall Glenda S | $122,000 | -- | |
| Keily | $68,000 | -- | |
| Kearin | $26,000 | -- | |
| Kearin | $25,000 | -- |
Source: Public Records
Mortgage History
| Date | Status | Borrower | Loan Amount |
|---|---|---|---|
| Previous Owner | Hall Glenda S | $72,000 |
Source: Public Records
Tax History
| Year | Tax Paid | Tax Assessment Tax Assessment Total Assessment is a certain percentage of the fair market value that is determined by local assessors to be the total taxable value of land and additions on the property. | Land | Improvement |
|---|---|---|---|---|
| 2025 | $4,046 | $95,240 | $56,410 | $38,830 |
| 2024 | $4,046 | $95,240 | $56,410 | $38,830 |
| 2023 | $2,941 | $62,237 | $27,755 | $34,482 |
| 2022 | $3,061 | $62,237 | $27,755 | $34,482 |
| 2021 | $2,892 | $62,237 | $27,755 | $34,482 |
| 2020 | $2,783 | $50,600 | $22,565 | $28,035 |
| 2019 | $2,796 | $50,600 | $22,565 | $28,035 |
| 2018 | $2,405 | $50,600 | $22,565 | $28,035 |
| 2017 | $2,451 | $46,295 | $20,874 | $25,421 |
| 2016 | $2,529 | $46,295 | $20,874 | $25,421 |
| 2015 | $2,547 | $46,295 | $20,874 | $25,421 |
| 2014 | $637 | $43,270 | $19,510 | $23,760 |
| 2013 | $2,394 | $50,040 | $22,560 | $27,480 |
Source: Public Records
Map
Nearby Homes
- 463 Valhalla Ct Unit 9-202
- 463 Valhalla Ct
- 401 Bethpage Way Unit 7-201
- 437 Bethpage Way Unit 7-303
- 23 N Broadway St
- 10 N Sycamore St
- 305 N Mechanic St Unit 7
- 305 N Mechanic St
- 24 Pleasant St Unit 3
- 4377 Waters Edge Ln
- 415 Summerlyn Farms Ct
- 246 Cincinnati Ave
- 517 E Warren St
- 201 Summit St
- 508 Creekside Ln
- 501 Creekside Ln
- 128 E Concord Dr
- 850 Sand Trap Place
- B Nelson Ln
- 0 Wilmington Rd Unit 1870799
- 119 E Main St
- 130 E Main St
- 13 S Cherry St
- 106 E Main St
- 129 E Main St
- 123 E Main St
- 204 E Main St
- 113 E Mulberry St
- 107 E Mulberry St
- 119 E Mulberry St
- 208 E Main St
- 203 E Main St
- 214 E Main St
- 120 E South St
- 4 Charleston Place Dr Unit Lt 4
- 45 E Mulberry St
- 112 S Cherry St
- 114 N Cherry St
- 114 S Cherry St
- 35 E Main St
Your Personal Tour Guide
Ask me questions while you tour the home.